.png)
Gold XAUUSD Daily Market Analysis—August 8, 2025 by K9 Investments Trading
- K9 Investments

- Aug 8, 2025
- 3 min read
💬 WhatsApp K9 Investments Trading here for FREE Gold Forex Live Trade Setups & Market Analysis.
Current Market Price
As of today, the live market price of Gold (XAUUSD) is $3398 USD. This analysis will delve into the daily and 4-hour time frames, utilizing various technical indicators to provide a comprehensive overview of the market.
Market Analysis Overview
In this section, we will explore the current market conditions for Gold (XAUUSD) through the lens of technical analysis. We will employ several indicators, including:
Support & Resistance Levels
Fibonacci Retracement Levels
Exponential Moving Averages (EMA)
RSI Divergence
Order Blocks
MACD
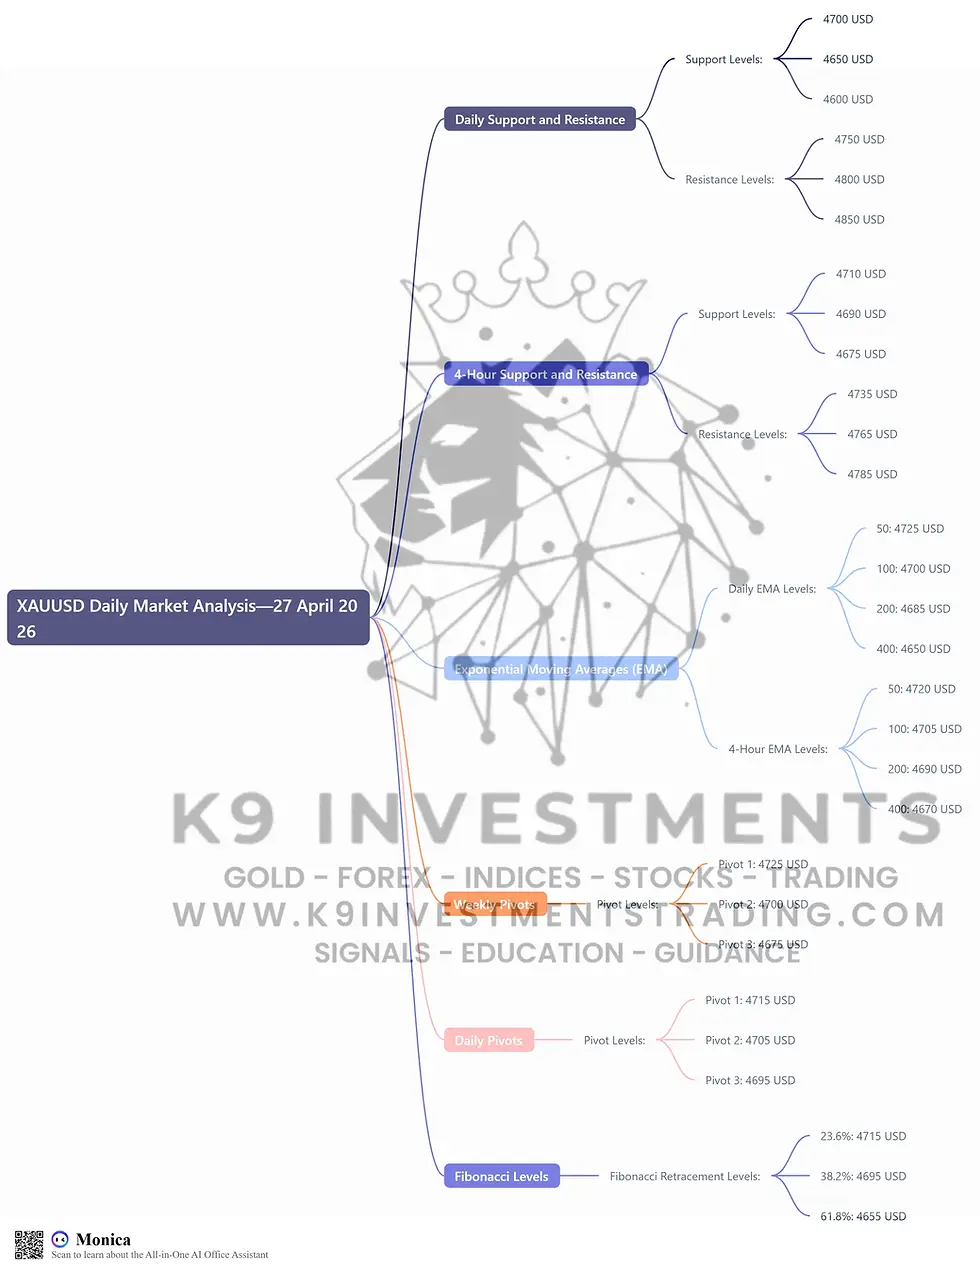
Support & Resistance Levels
Understanding support and resistance levels is crucial for identifying potential reversal points in the market.
Daily Time Frame:
Support Level 1: $3350
Support Level 2: $3325
Resistance Level 1: $3400
Resistance Level 2: $3425
4-Hour Time Frame:
Support Level 1: $3365
Support Level 2: $3340
Resistance Level 1: $3390
Resistance Level 2: $3415
Fibonacci Retracement Levels
Utilizing Fibonacci retracement levels helps identify potential reversal areas based on the market’s previous swings.
Daily Swing Levels:
23.6%: $3365
38.2%: $3340
61.8%: $3300
Exponential Moving Averages (EMA)
The Exponential Moving Averages provide insight into the trend direction and potential entry points.
Daily Time Frame:
EMA 50: $3380
EMA 100: $3355
EMA 200: $3320
EMA 400: $3290
4-Hour Time Frame:
EMA 50: $3395
EMA 100: $3370
EMA 200: $3345
EMA 400: $3310
RSI Divergence
The Relative Strength Index (RSI) indicates potential overbought or oversold conditions. Currently, the RSI is showing a divergence, suggesting a possible reversal.
Order Blocks
Identifying order blocks can help traders determine where significant buying or selling has occurred. Key order blocks are located around the $3350 and $3400 levels.
MACD Analysis
The Moving Average Convergence Divergence (MACD) is currently bullish, indicating a potential upward momentum in the Gold market.

Summary of Key Levels
💡 Gold XAUUSD Daily Analysis Summary by K9 Investments Trading – WhatsApp Us
🥇 FREE Telegram Channel: @K9_Investments_GoldTrading
Key Levels:
Daily Support Levels: $3350, $3325
Daily Resistance Levels: $3400, $3425
4-Hour Support Levels: $3365, $3340
4-Hour Resistance Levels: $3390, $3415
EMA Levels (Daily): 50: $3380, 100: $3355, 200: $3320, 400: $3290
EMA Levels (4-Hour): 50: $3395, 100: $3370, 200: $3345, 400: $3310
Weekly Pivots:
Pivot Point: $3380
Resistance 1: $3410
Support 1: $3350
Daily Pivots:
Pivot Point: $3390
Resistance 1: $3405
Support 1: $3370
Fibonacci Levels: 23.6%: $3365, 38.2%: $3340, 61.8%: $3300
Fundamental Analysis and USD News
📈 Upcoming USD News: Keep an eye on the upcoming Non-Farm Payroll (NFP) report and Federal Reserve meetings, as these events can significantly impact the Gold market. The NFP report, in particular, is crucial as it affects USD strength, which inversely correlates with Gold prices.
FAQs
Why is K9 Investments the best signal provider? K9 Investments offers not only FREE signals but also educational resources, daily market analysis, and ebooks.
Which brokers are trusted for Gold Forex Crypto trading? Based on client feedback, we recommend brokers like:
How can I receive daily trading signals? Join our FREE Telegram Channel for real-time updates: @K9_Investments_GoldTrading.
What is the benefit of using Fibonacci retracement in trading? Fibonacci retracement helps identify potential reversal levels based on historical price movements.
How does RSI divergence indicate market reversals? RSI divergence occurs when the price moves in the opposite direction of the RSI, signaling potential reversals.
What are order blocks in trading? Order blocks represent areas where significant buying or selling has occurred, indicating potential future price movements.
How can I improve my trading skills? Explore our Free K9 Trading Education Articles & Blog for valuable insights.
What is the importance of risk management in trading? Proper risk management is essential to protect your capital and ensure long-term trading success.
Conclusion
Gold (XAUUSD) remains a focal point for traders globally, including regions like Dubai, Singapore, India, Australia, Germany, and the Netherlands. Understanding the technical indicators and staying updated on fundamental news will enhance your trading strategy.
Disclaimer
Risk Warning: Trading Forex and CFDs carries a high level of risk to your capital and you should only trade with money you can afford to lose. Trading Forex and CFDs may not be suitable for all investors, so please ensure that you fully understand the risks involved and seek independent advice if necessary. Please read and ensure you fully understand our Risk Disclosure. Not Financial Advice. Trade at your own risk. Take Partial Profits, Use Strict Stop Loss and Proper Risk Management.
Hashtags
#GoldTrading #XAUUSD #ForexSignals #TradingAnalysis #K9Investments #ForexEducation #TradingSignals #MarketAnalysis


Comments