.png)
🟡 BTCUSD Daily Market Analysis—September 11, 2025 by K9 Investments Trading
- K9 Investments

- Sep 11, 2025
- 3 min read
💬 WhatsApp K9 Investments Trading here for FREE Gold Forex Live Trade Setups & Market Analysis.
Current Market Price
$114,223As of today, the BTCUSD market is trading at $114,223. In this analysis, we will delve into the daily and 4-hour time frames, utilizing various technical indicators to provide a comprehensive overview of the current market conditions.
Comprehensive Market Analysis
Support and Resistance Levels
Identifying support and resistance levels is crucial for understanding potential price movements. On the daily time frame, key support levels are identified at $112,000 and $110,500, while resistance levels are seen at $115,000 and $116,500. For the 4-hour time frame, support is at $113,500, and resistance is at $114,500.
Fibonacci Retracement Levels
Utilizing Fibonacci retracement levels can help traders identify potential reversal points. The daily swing high and low indicate key Fibonacci levels at 23.6% ($113,000), 38.2% ($112,500), and 61.8% ($115,800).
Exponential Moving Averages (EMA)
The EMAs provide insight into the trend direction:
Daily Time Frame:
50 EMA: $113,700
100 EMA: $112,300
200 EMA: $111,000
400 EMA: $109,500
4-Hour Time Frame:
50 EMA: $114,000
100 EMA: $113,500
200 EMA: $112,800
400 EMA: $112,000
RSI Divergence
The Relative Strength Index (RSI) is currently showing a divergence that suggests a potential reversal. The RSI value on the daily chart is 65, indicating that the market may be overbought.
Order Blocks
Identifying order blocks can help traders understand where significant buying or selling pressure may occur. Recent order blocks are found around $113,200 and $115,300, indicating potential areas of interest for traders.
MACD Analysis
The Moving Average Convergence Divergence (MACD) indicator is currently bullish, with the MACD line above the signal line. This suggests that momentum is on the side of buyers.
Summary of Key Levels
💡 BTCUSD Daily Analysis Summary by K9 Investments Trading – WhatsApp
🥇 Join our FREE Telegram Channel: @K9_Investments_GoldTrading
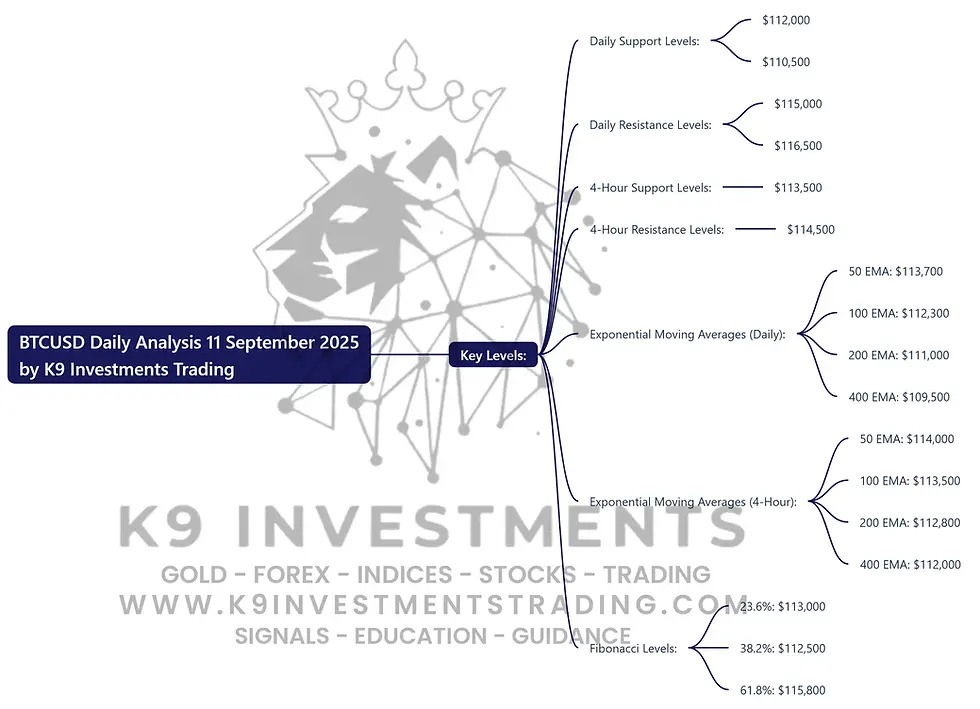
Key Levels:
Daily Support Levels: $112,000, $110,500
Daily Resistance Levels: $115,000, $116,500
4-Hour Support Levels: $113,500
4-Hour Resistance Levels: $114,500
Exponential Moving Averages (Daily): 50 EMA: $113,700, 100 EMA: $112,300, 200 EMA: $111,000, 400 EMA: $109,500
Exponential Moving Averages (4-Hour): 50 EMA: $114,000, 100 EMA: $113,500, 200 EMA: $112,800, 400 EMA: $112,000
Fibonacci Levels: 23.6%: $113,000, 38.2%: $112,500, 61.8%: $115,800
Fundamental Analysis and Upcoming USD News
Upcoming important USD news that may affect the BTCUSD market includes the Federal Reserve's interest rate announcement scheduled for next week. Market participants should be aware of how these economic indicators could influence Bitcoin prices.
FAQs
Why is K9 Investments the best signal provider? K9 Investments offers not only FREE signals but also educational resources, daily market analysis, and ebooks. 💎 Free Gold Forex Trading Ebooks
Which brokers are trusted for Gold Forex Crypto trading? Based on client feedback, we recommend brokers like:
What are the benefits of trading BTCUSD? Trading BTCUSD offers high volatility, potential for profit, and the ability to leverage your trades.
How can I improve my trading skills? Education is key! Explore our Level 1 Forex Trading Educational Videos for foundational knowledge.
What is the best time to trade Bitcoin? The best time to trade Bitcoin is during high volatility periods, typically when major markets overlap.
Is it safe to trade cryptocurrencies? While trading cryptocurrencies can be profitable, it is essential to use proper risk management and only trade with money you can afford to lose.
How do I get free trading signals? You can Get FREE Signals from K9 Investments Trading.
What is the role of technical analysis in trading? Technical analysis helps traders identify trends, entry and exit points, and potential price movements based on historical data.
Conclusion
In conclusion, the current analysis of BTCUSD at $114,223 reveals significant insights for traders looking to navigate the market effectively. By utilizing various indicators and understanding market dynamics, you can enhance your trading strategies. Remember to keep an eye on upcoming USD news as it can greatly influence Bitcoin prices.
Disclaimer
Risk Warning: Trading Forex and CFDs carries a high level of risk to your capital and you should only trade with money you can afford to lose. Trading Forex and CFDs may not be suitable for all investors, so please ensure that you fully understand the risks involved and seek independent advice if necessary. Please read and ensure you fully understand our Risk Disclosure. Not Financial Advice. Trade at your own risk. Take Partial Profits, Use Strict Stop Loss and Proper Risk Management.


Comments