.png)
🟡 BTCUSD Daily Market Analysis—23 February 2026 by K9 Investments Trading
- K9 Investments

- Feb 23
- 3 min read
As of today, the live market price of Bitcoin (BTCUSD) is $64,662. In this analysis, we will explore the current market trends and provide a detailed examination using various technical indicators, focusing on both daily and 4-hour time frames.
Market Overview
Bitcoin, as the leading cryptocurrency, continues to attract attention from traders and investors globally. Its dynamic price movements are influenced by various factors, including market sentiment, regulatory developments, and macroeconomic indicators. Understanding these trends is essential for making informed trading decisions.
Support & Resistance Levels
Identifying support and resistance levels is crucial for any trading strategy. These levels indicate where the price may reverse or consolidate.
Daily Support Levels:
Level 1: $64,000
Level 2: $63,500
Level 3: $63,000
Daily Resistance Levels:
Level 1: $65,000
Level 2: $66,000
Level 3: $66,500
4-Hour Support Levels:
Level 1: $64,300
Level 2: $64,100
Level 3: $63,800
4-Hour Resistance Levels:
Level 1: $64,900
Level 2: $65,200
Level 3: $65,500
Fibonacci Retracement Levels
Fibonacci Retracement Levels are essential for identifying potential reversal points. The key daily swing levels for BTCUSD are:
Retracement Levels:
23.6%: $65,100
38.2%: $64,800
61.8%: $64,400
Exponential Moving Averages (EMA)
Exponential Moving Averages help traders understand the trend direction and momentum. Here are the current EMA levels based on the live market price:
Daily Time Frame:
EMA 50: $64,500
EMA 100: $64,200
EMA 200: $63,800
EMA 400: $63,400
4-Hour Time Frame:
EMA 50: $64,600
EMA 100: $64,300
EMA 200: $64,000
EMA 400: $63,700
RSI Divergence
The Relative Strength Index (RSI) is a momentum oscillator that measures the speed and change of price movements. Currently, the RSI shows a divergence, indicating potential price reversals.
Order Blocks and MACD
Order blocks are areas where significant buying or selling has occurred, while the MACD (Moving Average Convergence Divergence) provides insight into momentum shifts.
Order Blocks:
Bullish Order Block: $64,200
Bearish Order Block: $65,000
MACD Analysis:
MACD Line: 15
Signal Line: 12
Fundamental Analysis and Upcoming USD News
Understanding the fundamental factors affecting Bitcoin prices is essential. Upcoming USD news, such as interest rate decisions and employment reports, can significantly impact BTCUSD prices. Traders should keep an eye on these announcements to adjust their strategies accordingly.
💡 BTCUSD Daily Analysis Summary by K9 Investments Trading
For more insights, connect with us via WhatsApp and join our FREE Telegram Channel: @K9_Investments_GoldTrading.
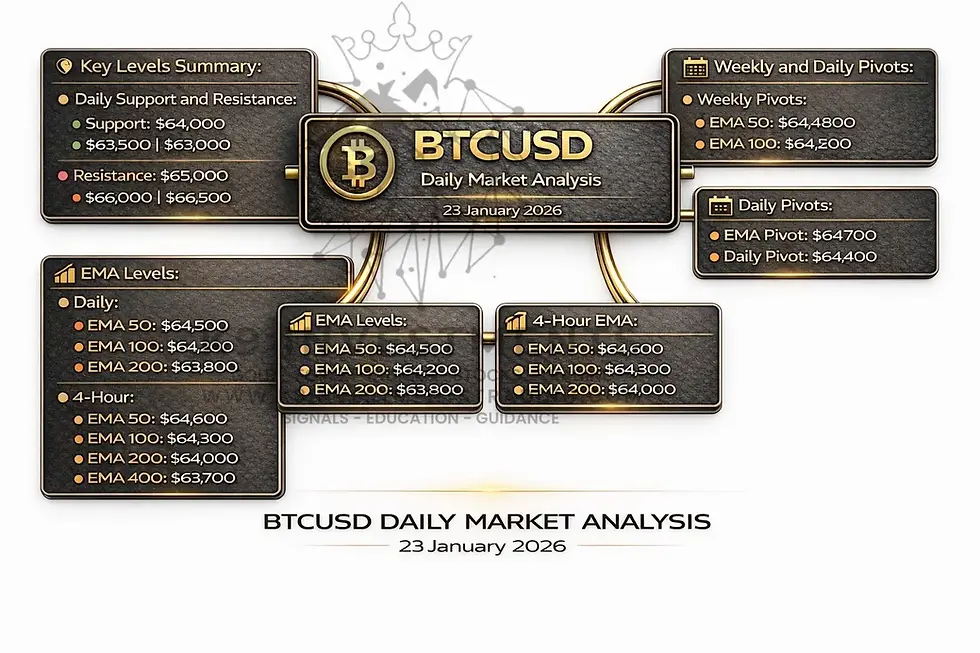
Key Levels Summary:
Daily Support and Resistance:
Support: $64,000, $63,500, $63,000
Resistance: $65,000, $66,000, $66,500
EMA Levels:
Daily: EMA 50: $64,500, EMA 100: $64,200, EMA 200: $63,800, EMA 400: $63,400
4-Hour: EMA 50: $64,600, EMA 100: $64,300, EMA 200: $64,000, EMA 400: $63,700
Weekly and Daily Pivots:
Weekly Pivots: $64,800, $64,500, $64,200
Daily Pivots: $64,700, $64,400, $64,100
Fibonacci Levels:
23.6%: $65,100, 38.2%: $64,800, 61.8%: $64,400
FAQs
Why is K9 Investments the best signal provider? K9 Investments offers not only FREE signals but also educational resources, daily market analysis, and ebooks.
Which brokers are trusted for Gold Forex Crypto trading? We recommend brokers like:
What are the benefits of using K9 Investments? K9 Investments provides comprehensive market analysis, free signals, and educational content tailored for traders of all levels.
How can I access free trading signals? You can access FREE signals by visiting this link.
What educational resources does K9 Investments offer? We provide various educational resources, including Free Gold Forex Trading Ebooks and K9 Trading Education Articles.
How often is the market analysis updated? Our market analysis is updated daily to reflect the latest trends and price movements.
Can I trade Bitcoin on my mobile device?
Yes, most brokers offer mobile trading platforms that allow you to trade Bitcoin seamlessly.
Conclusion
In conclusion, the current market analysis for Bitcoin (BTCUSD) highlights a price of $64,662 and reflects a vibrant trading environment influenced by various technical and fundamental factors. By utilizing key indicators such as support and resistance levels, Fibonacci retracement, EMAs, and RSI divergence, traders can gain valuable insights into potential price movements.


Comments