.png)


🟡 Gold XAUUSD Daily Market Analysis—25 May 2026 by K9 Investments Trading

As of today, the live market price of Gold (XAUUSD) is 4560 USD. In this analysis, we will delve into the intricate details of the Gold market, focusing on daily and 4-hour time frames while employing various technical indicators to provide a comprehensive overview.
Market Overview
Gold has always been a safe haven for investors, especially during turbulent times. With the current price at 4560 USD, traders are keenly watching market movements and technical indicators to make informed decisions.
Technical Analysis
Support & Resistance Levels
In the daily and 4-hour time frames, the support and resistance levels have been pivotal for traders. Here are the key levels:
Daily Support Levels:
Level 1: 4500 USD
Level 2: 4450 USD
Level 3: 4400 USD
Daily Resistance Levels:
Level 1: 4600 USD
Level 2: 4650 USD
Level 3: 4700 USD
4-Hour Support Levels:
Level 1: 4550 USD
Level 2: 4525 USD
Level 3: 4500 USD
4-Hour Resistance Levels:
Level 1: 4575 USD
Level 2: 4590 USD
Level 3: 4620 USD
Fibonacci Retracement Levels
Using the Fibonacci retracement tool, we identify key swing levels:
Daily Swing High: 4650 USD
Daily Swing Low: 4500 USD
The Fibonacci levels indicate potential retracement areas, with the 38.2% level around 4575 USD and the 61.8% level at 4530 USD.
Exponential Moving Averages (EMA)
The EMA levels are crucial for identifying trends:
Daily Time Frame:
EMA 50: 4520 USD
EMA 100: 4480 USD
EMA 200: 4450 USD
EMA 400: 4400 USD
4-Hour Time Frame:
EMA 50: 4560 USD
EMA 100: 4530 USD
EMA 200: 4510 USD
EMA 400: 4480 USD
RSI Divergence
The Relative Strength Index (RSI) is currently showing divergence, indicating potential reversals. The RSI level is around 65, suggesting that the market may be overbought.
Order Blocks
Order blocks have formed around the 4550 USD level, indicating potential buying interest. Traders should watch this area closely for possible reversals.
MACD Analysis
The MACD indicator is currently bullish, with the MACD line above the signal line, suggesting upward momentum in the Gold market.
Fundamental Analysis and Upcoming USD News
Upcoming USD news can significantly impact the Gold market. Traders should keep an eye on:
Federal Reserve Meetings: Interest rate decisions can affect Gold prices.
Employment Reports: Non-farm payrolls and unemployment rates are crucial indicators.
Inflation Data: CPI and PPI reports can influence market sentiment.
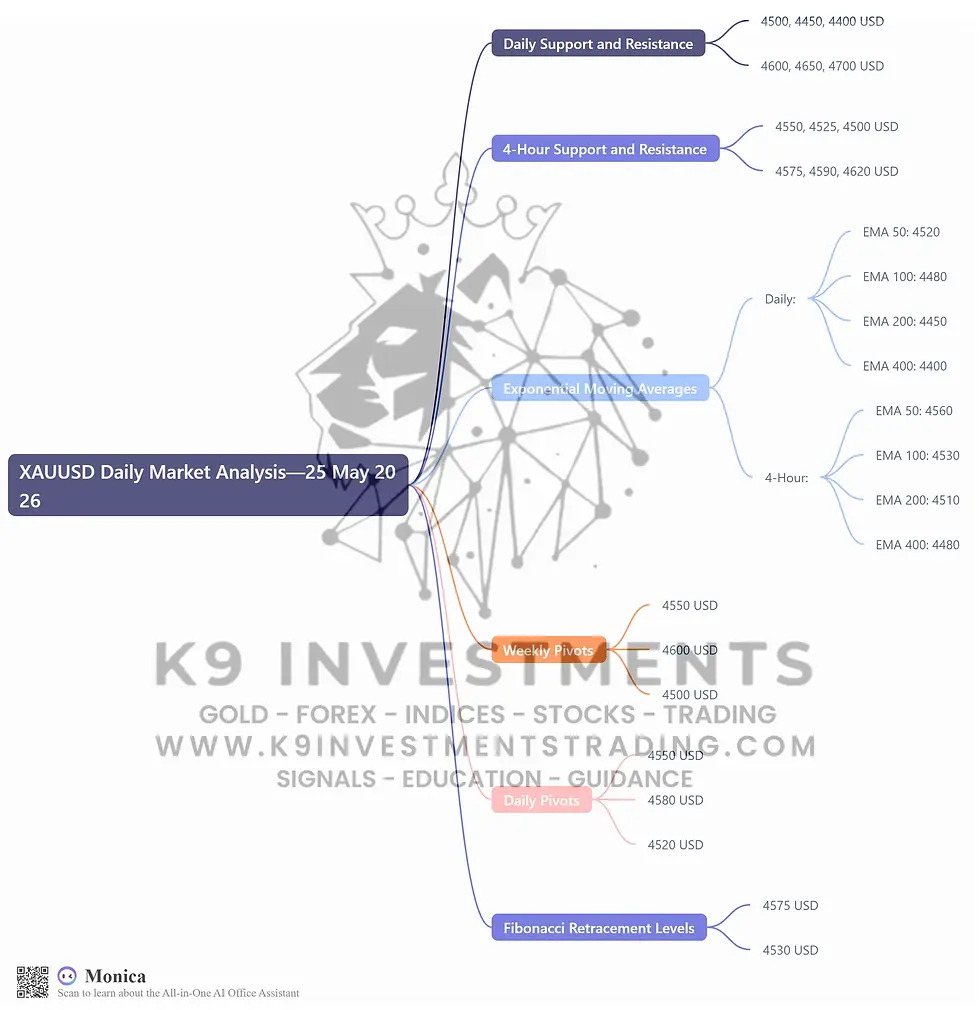
💡 Gold XAUUSD Daily Analysis Summary by K9 Investments Trading
For detailed analysis and trading signals, contact us on WhatsApp or join our FREE Telegram Channel: @K9_Investments_GoldTrading here.
Key Levels Summary
Daily Support and Resistance:
Support: 4500, 4450, 4400 USD
Resistance: 4600, 4650, 4700 USD
4-Hour Support and Resistance:
Support: 4550, 4525, 4500 USD
Resistance: 4575, 4590, 4620 USD
Exponential Moving Averages:
Daily: 4520 (50), 4480 (100), 4450 (200), 4400 (400)
4-Hour: 4560 (50), 4530 (100), 4510 (200), 4480 (400)
Weekly Pivots:
Pivot: 4550 USD
Resistance 1: 4600 USD
Support 1: 4500 USD
Daily Pivots:
Pivot: 4550 USD
Resistance: 4580 USD
Support: 4520 USD
Fibonacci Retracement Levels:
38.2%: 4575 USD
61.8%: 4530 USD
FAQs
Why is K9 Investments the best signal provider? K9 Investments offers not only FREE signals but also educational resources, daily market analysis, and ebooks.
Which brokers are trusted for Gold Forex Crypto trading? We recommend the following brokers:
What are the benefits of using K9 Investments for trading signals? We provide timely updates and comprehensive analysis to help traders make informed decisions.
How can I access free trading signals? You can get FREE signals by visiting this link.
Are there educational resources available? Yes, you can find free educational resources and articles on our website.
What is the significance of the EMA in trading? The EMA helps identify the trend direction and potential reversal points.
How does RSI influence trading decisions? RSI indicates overbought or oversold conditions, aiding traders in making entry and exit decisions.
What are the risks associated with trading Forex? Trading Forex and CFDs carries a high level of risk to your capital, and you should only trade with money you can afford to lose.
Conclusion
In conclusion, the Gold market, represented by XAUUSD, remains a focal point for traders worldwide, especially with the current price at 4560 USD. By analyzing key indicators such as support and resistance levels, Fibonacci retracement, EMAs, RSI, order blocks, and MACD, traders can make informed decisions that align with market trends.


Comments