BTCUSD Daily Market Analysis—September 1, 2025 by K9 Investments Trading
- K9 Investments

- Sep 1, 2025
- 3 min read
💬 WhatsApp K9 Investments Trading here for FREE Gold Forex Live Trade Setups & Market Analysis.
Current Market Overview
As of today, the live market price of Bitcoin (BTCUSD) stands at 107,442 USD. This analysis will explore the daily and 4-hour time frames, utilizing various technical indicators to provide a comprehensive market outlook.
Market Analysis
Support & Resistance Levels
Understanding support and resistance levels is crucial for traders. Here are the key levels identified on both the daily and 4-hour time frames:
Daily Support Levels:
Level 1: 105,000 USD
Level 2: 103,000 USD
Level 3: 100,000 USD
Daily Resistance Levels:
Level 1: 110,000 USD
Level 2: 112,500 USD
Level 3: 115,000 USD
4-Hour Support Levels:
Level 1: 106,500 USD
Level 2: 106,000 USD
Level 3: 105,500 USD
4-Hour Resistance Levels:
Level 1: 108,000 USD
Level 2: 109,000 USD
Level 3: 110,500 USD
Fibonacci Retracement Levels
Using Fibonacci retracement levels, we identify the following daily swing levels:
Key Retracement Levels:
23.6%: 107,000 USD
38.2%: 106,000 USD
61.8%: 104,500 USD
These levels can serve as potential reversal points and entry opportunities for traders.
Exponential Moving Averages (EMA)
The EMA indicators assist in identifying trends and potential reversals. Here are the current EMA values based on the live market price:
Daily Time Frame:
EMA 50: 108,000 USD
EMA 100: 106,500 USD
EMA 200: 105,000 USD
EMA 400: 103,500 USD
4-Hour Time Frame:
EMA 50: 107,500 USD
EMA 100: 107,000 USD
EMA 200: 106,500 USD
EMA 400: 106,000 USD
RSI Divergence
The Relative Strength Index (RSI) indicates potential overbought or oversold conditions. Currently, the RSI shows divergence, suggesting that the price may soon reverse, providing traders with potential entry points.
Order Blocks
Identifying order blocks helps us understand market sentiment. Recent order blocks indicate strong buying interest around the 105,000 USD level, while selling pressure is evident near the 110,000 USD mark.
MACD Analysis
The Moving Average Convergence Divergence (MACD) is currently bullish, indicating potential upward momentum. However, traders should remain cautious of possible corrections.

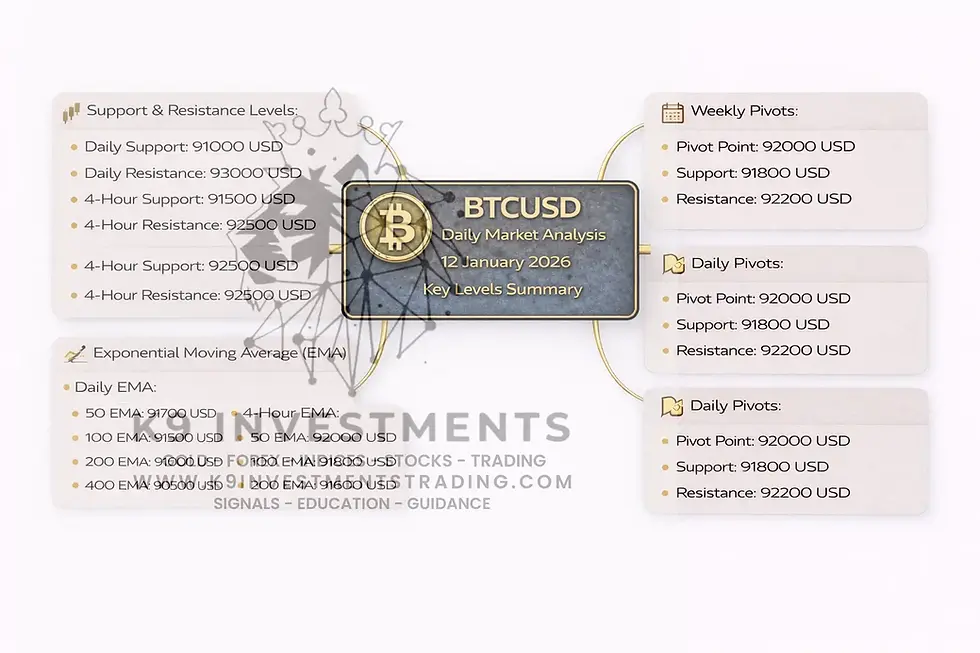
Summary of Key Levels
💡 BTCUSD Daily Analysis Summary by K9 Investments Trading – Contact Us
🥇 FREE Telegram Channel: @K9_Investments_GoldTrading
Key Levels Recap:
Daily Support and Resistance:
Support: 105,000, 103,000, 100,000 USD
Resistance: 110,000, 112,500, 115,000 USD
Exponential Moving Averages (EMA):
Daily: 50 (108,000), 100 (106,500), 200 (105,000), 400 (103,500)
4-Hour: 50 (107,500), 100 (107,000), 200 (106,500), 400 (106,000)
Weekly Pivots:
Pivot Point: 106,500 USD
Resistance: 108,000, 109,500 USD
Support: 105,000, 104,000 USD
Daily Pivots:
Pivot Point: 107,000 USD
Resistance: 108,500, 109,000 USD
Support: 106,500, 106,000 USD
Fibonacci Retracement Levels:
23.6%: 107,000 USD
38.2%: 106,000 USD
61.8%: 104,500 USD
Fundamental Analysis and Upcoming USD News
📈 The upcoming week holds significant USD news that could impact the Bitcoin (BTCUSD) market. Key events include:
Non-Farm Payrolls: Scheduled for September 5, 2025, this report often influences Bitcoin prices due to its impact on inflation and interest rates.
Consumer Price Index (CPI): Expected on September 10, 2025, this data will provide insights into inflation, affecting Bitcoin's safe-haven status.
Traders should remain vigilant and adjust their strategies accordingly.
Frequently Asked Questions (FAQs)
1. Why is K9 Investments the best signal provider?
K9 Investments offers not only FREE signals but also educational resources, daily market analysis, and ebooks.
2. Which brokers are trusted for Gold Forex Crypto trading?
Based on client feedback, we recommend the following brokers:
3. What are the benefits of using K9 Investments' signals?
Our signals are designed to enhance trading strategies, providing timely insights and analysis to maximize profits.
4. How can I access your trading education resources?
You can explore our educational resources through our Free Gold Forex Trading Ebooks and K9 Trading Education Articles.
5. What is the best time to trade Bitcoin?
The best time to trade Bitcoin is during the overlap of the London and New York sessions, typically between 12 PM and 4 PM GMT.
6. How do I manage risk while trading Bitcoin?
Implementing strict stop-loss orders, taking partial profits, and adhering to proper risk management strategies are essential for successful trading.
7. Can I trade Bitcoin with a small capital?
Yes, many brokers offer leverage, allowing traders to control larger positions with a smaller amount of capital. However, caution is advised.
8. How does economic news affect Bitcoin prices?
Economic news, particularly related to the USD, can significantly impact Bitcoin prices. Traders should stay informed of upcoming news events.
Conclusion
In summary, the current market analysis for Bitcoin (BTCUSD) indicates various trading opportunities based on technical indicators and upcoming economic events. For more insights, feel free to reach out to K9 Investments Trading and join our community.
.png)


Comments