.png)
🟡 BTCUSD Daily Market Analysis—October 13, 2025 by K9 Investments Trading
- K9 Investments

- Oct 13, 2025
- 4 min read
💬 WhatsApp K9 Investments Trading here for FREE Gold Forex Live Trade Setups & Market Analysis.
Current BTCUSD Market Price
As of today, the live market price of Bitcoin (BTCUSD) is 114,749 USD. In this analysis, we will delve into the current market dynamics, focusing on daily and 4-hour time frames. We will utilize key indicators such as Fibonacci Retracement Levels, EMA, RSI divergence, Weekly and Daily Pivots, Smart Money Concepts (SMC), Support & Resistance Levels, Order Blocks, and MACD to provide a comprehensive overview.
Market Analysis Overview
The Bitcoin market is influenced by various factors, including economic data, geopolitical events, and market sentiment. Understanding these elements is crucial for traders looking to capitalize on price movements.
Support & Resistance Levels
Support and resistance levels are critical for identifying potential entry and exit points. On the daily timeframe, we have identified key levels that traders should monitor closely.
Daily Support Levels: 113,500 USD, 112,000 USD, 110,000 USD
Daily Resistance Levels: 116,000 USD, 117,500 USD, 119,000 USD
On the 4-hour timeframe, the support and resistance levels are slightly different due to the shorter time frame's volatility:
4-Hour Support Levels: 114,200 USD, 113,800 USD, 113,500 USD
4-Hour Resistance Levels: 115,000 USD, 115,500 USD, 116,200 USD
Fibonacci Retracement Levels
Fibonacci retracement levels help identify potential reversal points in the market. For today's analysis, we will focus on the following daily swing levels:
Key Fibonacci Levels:
38.2% at 114,300 USD
50% at 114,750 USD
61.8% at 115,200 USD
These levels will play a significant role in determining the market's direction in the coming hours.
Exponential Moving Averages (EMA)
The EMA is a valuable tool for traders to gauge market trends. We will analyze the following EMA levels:
Daily EMA Levels:
EMA 50: 114,600 USD
EMA 100: 114,200 USD
EMA 200: 113,800 USD
EMA 400: 113,000 USD
4-Hour EMA Levels:
EMA 50: 114,800 USD
EMA 100: 114,600 USD
EMA 200: 114,300 USD
EMA 400: 113,900 USD
RSI Divergence
The Relative Strength Index (RSI) is an essential momentum indicator. Currently, the RSI on the daily timeframe is at 55, indicating a neutral position. However, on the 4-hour timeframe, we observe a slight divergence, suggesting potential bullish momentum if the price breaks above the resistance levels.
Order Blocks
Order blocks represent areas where significant buying or selling has occurred. Identifying these areas can provide insight into future price movements. Key order blocks for today's analysis are located around the 114,000 USD and 115,000 USD levels.
MACD Analysis
The MACD indicator shows the relationship between two moving averages. Currently, the MACD histogram is positive, indicating bullish momentum. Traders should watch for crossovers that could signal entry points.
Fundamental Analysis and Upcoming USD News
Fundamental factors also play a significant role in Bitcoin pricing. Upcoming USD news events include:
CPI Data Release: Expected to influence market volatility.
Federal Reserve Meeting: Potential interest rate changes could affect Bitcoin prices.
Traders should stay informed about these events as they can lead to significant price fluctuations.

💡 BTCUSD Daily Analysis Summary by K9 Investments Trading
💬 WhatsApp Us here for FREE Gold Forex Live Trade Setups & Market Analysis.
🥇 Join our FREE Telegram Channel @K9_Investments_GoldTrading.
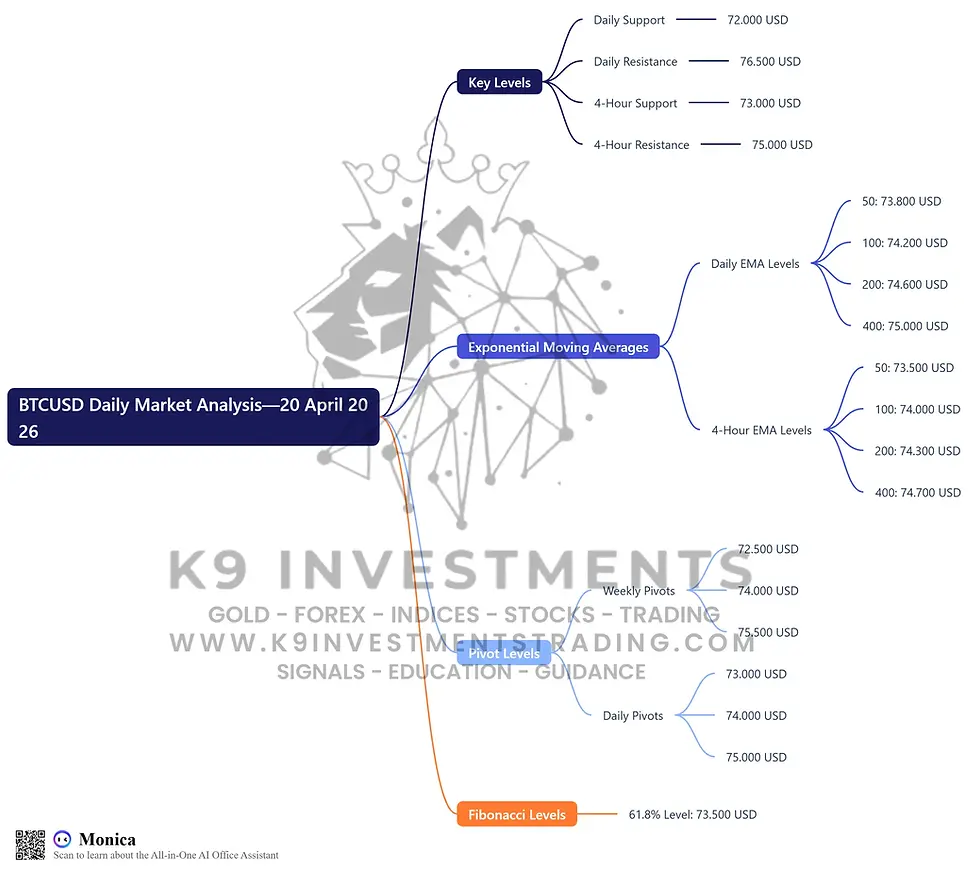
Key Levels:
Daily Support and Resistance:
Support: 113,500 USD, 112,000 USD, 110,000 USD
Resistance: 116,000 USD, 117,500 USD, 119,000 USD
Exponential Moving Average (EMA) Levels:
Daily:
EMA 50: 114,600 USD
EMA 100: 114,200 USD
EMA 200: 113,800 USD
EMA 400: 113,000 USD
4-Hour:
EMA 50: 114,800 USD
EMA 100: 114,600 USD
EMA 200: 114,300 USD
EMA 400: 113,900 USD
Weekly Pivots:
Pivot 1: 115,000 USD
Pivot 2: 114,750 USD
Pivot 3: 114,500 USD
Daily Pivots:
Pivot 1: 114,800 USD
Pivot 2: 114,600 USD
Pivot 3: 114,400 USD
Fibonacci Retracement Levels:
38.2% at 114,300 USD
50% at 114,750 USD
61.8% at 115,200 USD
FAQs
1. Why is K9 Investments the best signal provider?
K9 Investments offers not only FREE signals but also educational resources, daily market analysis, and ebooks. 💎 Get FREE Signals
2. Which brokers are trusted for Gold Forex Crypto trading?
Based on client feedback, we recommend brokers like:
3. How can I improve my trading skills?
Utilize K9 Trading Education Articles & Blog here.
4. What is the best strategy for trading Bitcoin?
A combination of technical analysis, market news, and risk management strategies is essential for successful Bitcoin trading.
5. How do I access K9 Investments’ signals?
You can get FREE Signals here.
6. What is the importance of risk management in trading?
Risk management is crucial to protect your capital and ensure long-term success in trading.
7. How often are trading signals updated?
K9 Investments provides real-time updates to ensure traders have the most accurate information.
8. What educational resources does K9 Investments offer?
K9 Investments offers a variety of educational resources, including ebooks and video tutorials. 💎 Free Gold Forex Trading Ebooks
Disclaimer
Risk Warning: Trading Forex and CFDs carries a high level of risk to your capital, and you should only trade with money you can afford to lose. Trading Forex and CFDs may not be suitable for all investors, so please ensure that you fully understand the risks involved and seek independent advice if necessary. Please read and ensure you fully understand our Risk Disclosure. Not Financial Advice. Trade at your own risk. Take Partial Profits, Use Strict Stop Loss and Proper Risk Management.


Comments