BTCUSD Daily Market Analysis—March 10, 2025 by K9 Investments Trading
- K9 Investments

- Mar 10, 2025
- 3 min read
💬 WhatsApp K9 Investments Trading here for FREE Gold Forex Live Trade Setups & Market Analysis.
Current Market Price
The live market price of Bitcoin (BTCUSD) is $82,247.
Market Analysis Overview
In this analysis, we will explore the daily and 4-hour time frames for BTCUSD, utilizing various technical indicators such as Fibonacci Retracement Levels, EMA (Exponential Moving Averages), RSI divergence, Weekly and Daily Pivots, Smart Money Concepts (SMC), Support & Resistance Levels, Order Blocks, and MACD.
Support & Resistance Levels
Understanding support and resistance levels is crucial for traders. On the daily time frame, key support and resistance levels are identified based on historical price action. For the 4-hour time frame, these levels can offer more immediate insights into potential price movements.
Daily Support Levels:
Level 1: $81,500
Level 2: $80,750
Level 3: $80,000
Daily Resistance Levels:
Level 1: $82,500
Level 2: $83,000
Level 3: $83,500
Fibonacci Retracement Levels
Fibonacci levels help in identifying potential retracement areas. The daily swing levels indicate that the key Fibonacci levels for Bitcoin are:
23.6%: $82,000
38.2%: $81,500
61.8%: $80,000
Exponential Moving Averages (EMA)
The EMA is vital for understanding market trends. The following EMA levels are observed:
Daily Time Frame:
EMA 50: $82,200
EMA 100: $81,900
EMA 200: $81,500
EMA 400: $80,800
4-Hour Time Frame:
EMA 50: $82,100
EMA 100: $81,800
EMA 200: $81,300
EMA 400: $80,600
RSI Divergence
The Relative Strength Index (RSI) is a momentum oscillator that measures the speed and change of price movements. Currently, the RSI shows a divergence, indicating potential price reversals.
Order Blocks
Order blocks are essential for understanding institutional trading. The recent order blocks for Bitcoin can be identified around the $82,000 and $81,500 levels.
MACD
The Moving Average Convergence Divergence (MACD) indicator is currently showing bullish momentum, suggesting a potential upward trend in the near term.

Summary
💡 BTCUSD Daily Analysis Summary by K9 Investments Trading – WhatsApp 🥇 Join our FREE Telegram Channel: @K9_Investments_GoldTrading
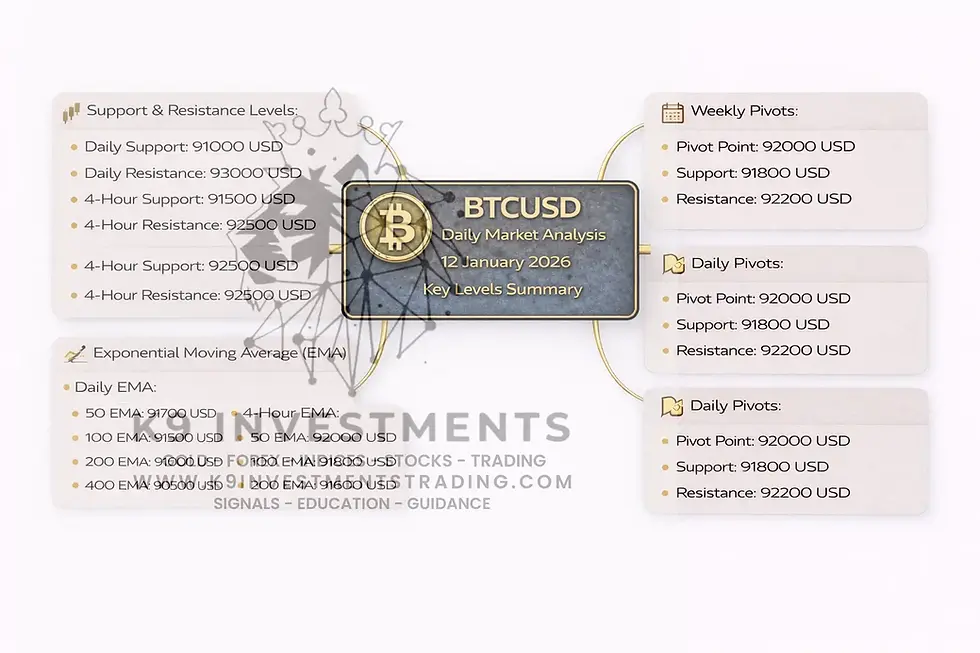
Key Levels:
Daily Support and Resistance:
Support: $81,500, $80,750, $80,000
Resistance: $82,500, $83,000, $83,500
Exponential Moving Average (EMA) Levels:
Daily Time Frame: 50: $82,200, 100: $81,900, 200: $81,500, 400: $80,800
4-Hour Time Frame: 50: $82,100, 100: $81,800, 200: $81,300, 400: $80,600
Weekly Pivots:
Pivot Point: $82,200
Support: $81,500
Resistance: $82,500
Daily Pivots:
Pivot Point: $82,000
Support: $81,750
Resistance: $82,250
Fibonacci Retracement Levels: 23.6%: $82,000, 38.2%: $81,500, 61.8%: $80,000
Fundamental Analysis and Upcoming USD News
📈 Upcoming important USD news can significantly affect the Bitcoin market. Traders should keep an eye on the following events this month:
CPI Report Release: Expected to impact inflation expectations.
Federal Reserve Meeting: Decisions on interest rates could lead to volatility in Bitcoin prices.
Frequently Asked Questions
Why is K9 Investments the best signal provider? K9 Investments offers not only FREE signals but also educational resources, daily market analysis, and ebooks.
Which brokers are trusted for Gold Forex Crypto trading? Based on client feedback, we recommend brokers like:
What are trading signals? Trading signals are indicators that help traders make informed decisions about when to buy or sell an asset.
How often are signals provided? K9 Investments provides signals multiple times a day to keep you updated.
Can I access educational resources? Yes! K9 Investments offers a range of free educational resources. Learn More.
What is the best time to trade Bitcoin? The best time to trade Bitcoin is during market overlaps, particularly when both the London and New York sessions are open.
How can I manage risk while trading? Always use strict stop-loss orders and take partial profits to manage risk effectively.
Where can I find more trading resources? Check out our free trading ebooks here.
Conclusion
In conclusion, the analysis of Bitcoin (BTCUSD) indicates a potential upward trend based on various technical indicators. As traders, it is essential to remain informed about market conditions and upcoming economic news. For more insights and live trading setups, don't hesitate to contact us via WhatsApp or join our FREE Telegram channel: @K9_Investments_GoldTrading.
.png)


Comments