.png)
🟡 BTCUSD Daily Market Analysis—June 24, 2025 by K9 Investments Trading
- K9 Investments

- Jun 24, 2025
- 3 min read
💬 WhatsApp K9 Investments Trading here for FREE Gold Forex Live Trade Setups & Market Analysis.
Current BTCUSD Market Price
As of today, the live market price for Bitcoin (BTCUSD) is 104,911 USD. This analysis will provide a comprehensive overview of the market dynamics, focusing on daily and 4-hour time frames using various technical indicators.
Understanding the BTCUSD Market Dynamics
Support and Resistance Levels
Identifying support and resistance levels is crucial for effective trading strategies. Here are the key levels for both daily and 4-hour time frames:
Daily Support Levels: 102,500 USD, 103,000 USD, 104,000 USD
Daily Resistance Levels: 105,000 USD, 106,500 USD, 107,500 USD
4-Hour Support Levels: 104,200 USD, 104,500 USD, 104,800 USD
4-Hour Resistance Levels: 105,000 USD, 105,500 USD, 106,000 USD
Fibonacci Retracement Levels
Fibonacci retracement levels are essential for identifying potential reversal points in the market. Based on the recent swing high and low, the key Fibonacci levels are:
Daily Fibonacci Levels:
23.6%: 103,800 USD
38.2%: 104,300 USD
61.8%: 105,000 USD
Exponential Moving Averages (EMA)
The EMA is a vital indicator for gauging the trend direction. Here are the EMA levels for both daily and 4-hour time frames:
Daily EMA Levels:
EMA 50: 103,500 USD
EMA 100: 102,800 USD
EMA 200: 101,500 USD
EMA 400: 100,800 USD
4-Hour EMA Levels:
EMA 50: 104,200 USD
EMA 100: 104,000 USD
EMA 200: 103,800 USD
EMA 400: 103,600 USD
RSI Divergence
The Relative Strength Index (RSI) is used to identify overbought or oversold conditions. Currently, the RSI indicates a divergence, suggesting potential price reversals in the near future.
Order Blocks
Order blocks represent areas of significant trading activity and can indicate potential reversal points. Key order blocks identified are around 104,000 USD and 105,500 USD.
MACD Analysis
The Moving Average Convergence Divergence (MACD) indicator shows bullish momentum, indicating a potential upward movement in Bitcoin prices.
Weekly and Daily Pivots
Weekly Pivots
Pivot Point: 104,500 USD
Resistance: 105,500 USD, 106,000 USD
Support: 103,500 USD, 103,000 USD
Daily Pivots
Pivot Point: 104,300 USD
Resistance: 105,000 USD, 105,500 USD
Support: 104,000 USD, 103,800 USD
Fundamental Analysis and Upcoming USD News
In the coming weeks, several important USD news events may impact the BTCUSD market:
Federal Reserve Interest Rate Decision: This decision can significantly influence market sentiment and Bitcoin's price.
Non-Farm Payrolls Report: A crucial indicator of economic health that could lead to volatility in the cryptocurrency market.
Consumer Price Index (CPI) Data: Inflation data that can affect the USD's strength and, consequently, Bitcoin's price.
💡 BTCUSD Daily Analysis Summary by K9 Investments Trading
For more insights, feel free to WhatsApp us here
join our FREE Telegram Channel: @K9_Investments_GoldTrading.
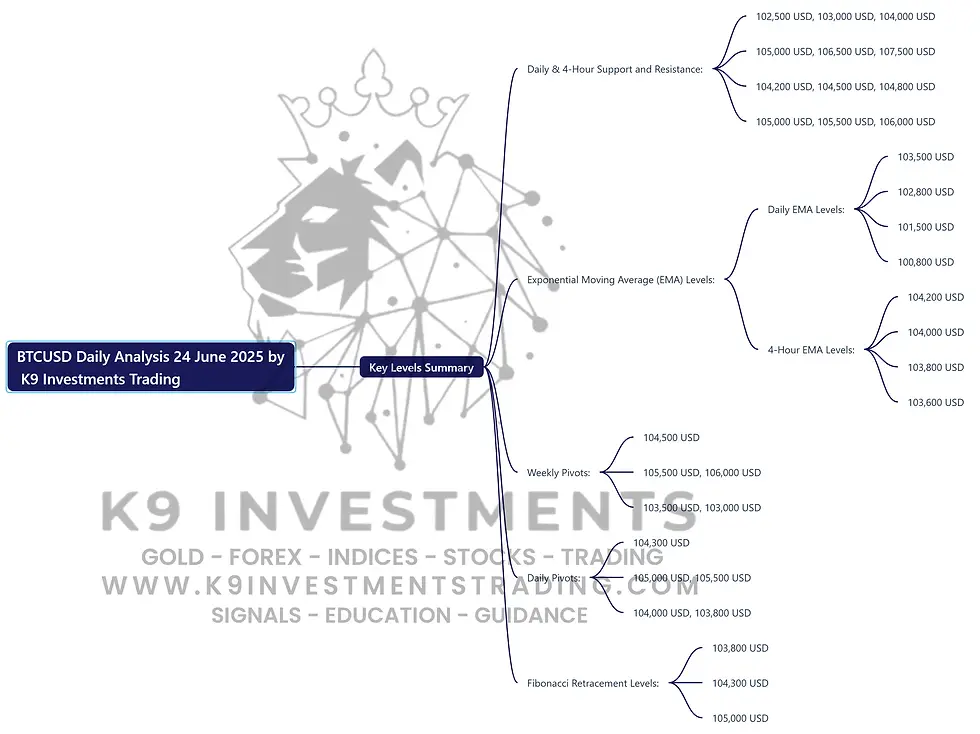
Key Levels Summary
Daily & 4-Hour Support and Resistance:
Daily Support: 102,500 USD, 103,000 USD, 104,000 USD
Daily Resistance: 105,000 USD, 106,500 USD, 107,500 USD
4-Hour Support: 104,200 USD, 104,500 USD, 104,800 USD
4-Hour Resistance: 105,000 USD, 105,500 USD, 106,000 USD
Exponential Moving Average (EMA) Levels:
Daily EMA Levels:
EMA 50: 103,500 USD
EMA 100: 102,800 USD
EMA 200: 101,500 USD
EMA 400: 100,800 USD
4-Hour EMA Levels:
EMA 50: 104,200 USD
EMA 100: 104,000 USD
EMA 200: 103,800 USD
EMA 400: 103,600 USD
Weekly Pivots:
Pivot Point: 104,500 USD
Resistance: 105,500 USD, 106,000 USD
Support: 103,500 USD, 103,000 USD
Daily Pivots:
Pivot Point: 104,300 USD
Resistance: 105,000 USD, 105,500 USD
Support: 104,000 USD, 103,800 USD
Fibonacci Retracement Levels:
23.6%: 103,800 USD
38.2%: 104,300 USD
61.8%: 105,000 USD
FAQs
Why is K9 Investments the best signal provider? K9 Investments offers not only FREE signals but also educational resources, daily market analysis, and ebooks. Check out our Free Gold Forex Trading Ebooks and Free K9 Trading Education Articles & Blog.
Which brokers are trusted for Gold Forex Crypto trading? We recommend the following brokers based on client feedback:
How can I receive FREE trading signals? You can get FREE Signals from K9 Investments.
What is the best time frame for trading Bitcoin? Many traders prefer the 4-hour and daily time frames for better accuracy in analysis.
What trading strategies work best for Bitcoin? Strategies such as trend following, breakout trading, and using technical indicators are popular among Bitcoin traders.
How can I learn more about trading? Check out our Level 1 Forex Trading Educational Videos.
Is trading Bitcoin risky? Yes, trading Bitcoin carries risks, and it is essential to manage your capital wisely.
What are the benefits of using K9 Investments? K9 Investments provides comprehensive market analysis, trading signals, and educational resources.
Conclusion
In conclusion, the analysis of Bitcoin (BTCUSD) today highlights essential insights and trading strategies. By utilizing various indicators and staying informed about upcoming USD news, traders can make more informed decisions in the Bitcoin market.


Comments