.png)
🟡 BTCUSD Daily Market Analysis—August 6, 2025 by K9 Investments Trading
- K9 Investments

- Aug 6, 2025
- 3 min read
💬 WhatsApp K9 Investments Trading here for FREE Gold Forex Live Trade Setups & Market Analysis.
Current Market Overview
The live market price of Bitcoin (BTCUSD) is 113,456 USD. This analysis will provide a detailed overview of the current market conditions, utilizing various technical indicators to assist traders in making informed decisions.
Market Analysis
Support and Resistance Levels
Understanding support and resistance levels is crucial for identifying potential price points where the market may reverse or consolidate.
Daily Time Frame:
Support Levels:
Level 1: 112,000 USD
Level 2: 110,500 USD
Level 3: 109,000 USD
Resistance Levels:
Level 1: 115,000 USD
Level 2: 116,500 USD
Level 3: 118,000 USD
4-Hour Time Frame:
Support Levels:
Level 1: 112,500 USD
Level 2: 111,000 USD
Level 3: 110,000 USD
Resistance Levels:
Level 1: 114,000 USD
Level 2: 115,500 USD
Level 3: 116,000 USD
Fibonacci Retracement Levels
Fibonacci retracement levels help identify potential reversal points based on the recent swing high and low.
Retracement Levels:
23.6%: 114,000 USD
38.2%: 113,000 USD
61.8%: 111,500 USD
Exponential Moving Averages (EMA)
The EMA provides insights into the trend direction and potential reversal points.
Daily Time Frame:
EMA 50: 112,500 USD
EMA 100: 111,000 USD
EMA 200: 109,500 USD
EMA 400: 107,000 USD
4-Hour Time Frame:
EMA 50: 113,000 USD
EMA 100: 112,000 USD
EMA 200: 110,500 USD
EMA 400: 109,000 USD
RSI Divergence
The Relative Strength Index (RSI) helps identify potential overbought or oversold conditions.
Current RSI: 68 (indicating overbought conditions)
Divergence: Bearish divergence observed as price makes higher highs while RSI makes lower highs.
Order Blocks
Order blocks indicate areas where large orders have previously been placed, often leading to significant price movements.
Bullish Order Block: 110,000-111,000 USD
Bearish Order Block: 115,000-116,000 USD
MACD Analysis
The Moving Average Convergence Divergence (MACD) is a trend-following momentum indicator.
Current MACD: Positive, indicating bullish momentum.
Signal Line Cross: MACD line is above the signal line, suggesting a continuation of the upward trend.
Fundamental Analysis and USD News
Upcoming USD News
Non-Farm Payrolls (NFP): Scheduled for August 10, 2025. A higher-than-expected NFP could strengthen the USD, leading to downward pressure on Bitcoin prices.
Consumer Price Index (CPI): Expected release on August 15, 2025. Inflation data influences Bitcoin as a hedge against inflation.

💡 BTCUSD Daily Analysis Summary by K9 Investments Trading
For more insights, contact us on WhatsApp
join our FREE Telegram Channel @K9_Investments_GoldTrading here.
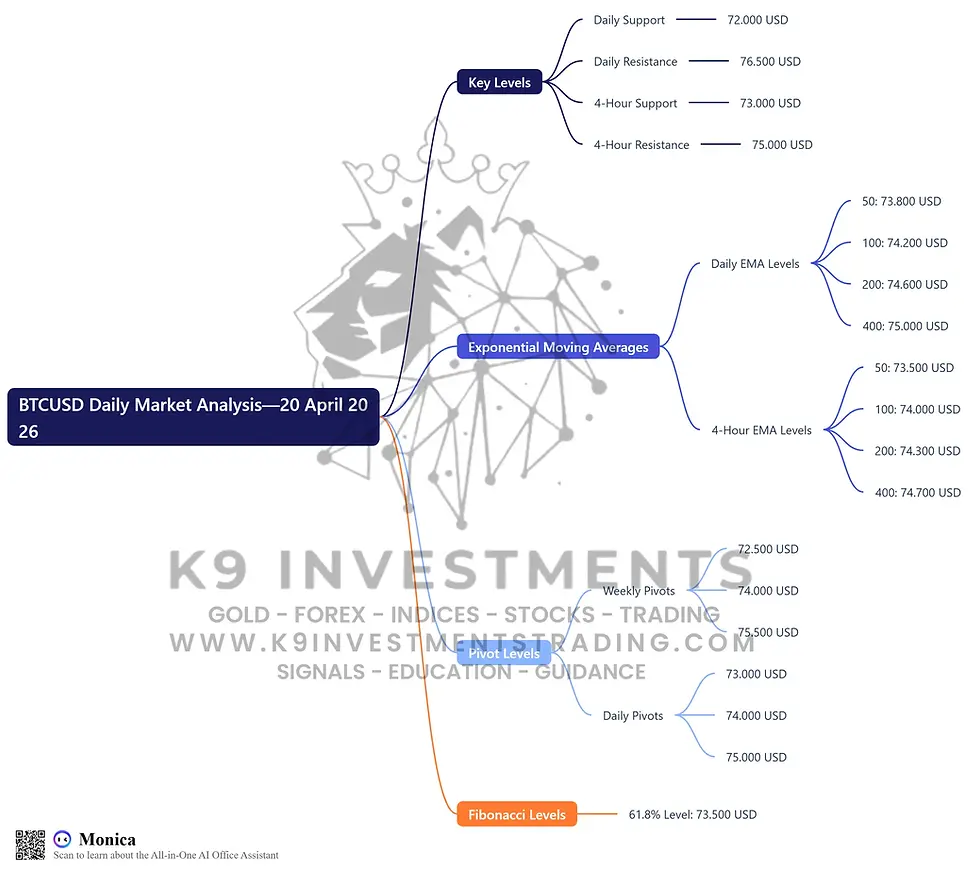
Key Levels Summary
Daily Support and Resistance:
Support: 112,000 USD, 110,500 USD, 109,000 USD
Resistance: 115,000 USD, 116,500 USD, 118,000 USD
4-Hour Support and Resistance:
Support: 112,500 USD, 111,000 USD, 110,000 USD
Resistance: 114,000 USD, 115,500 USD, 116,000 USD
Exponential Moving Average (EMA) Levels:
Daily: 112,500 USD (50), 111,000 USD (100), 109,500 USD (200), 107,000 USD (400)
4-Hour: 113,000 USD (50), 112,000 USD (100), 110,500 USD (200), 109,000 USD (400)
Weekly Pivots:
Pivot: 113,500 USD
Support: 112,000 USD, 110,000 USD
Resistance: 115,000 USD, 116,000 USD
Daily Pivots:
Pivot: 113,000 USD
Support: 112,500 USD, 111,500 USD
Resistance: 114,500 USD, 115,000 USD
Fibonacci Retracement Levels:
23.6%: 114,000 USD
38.2%: 113,000 USD
61.8%: 111,500 USD
FAQs
Why is K9 Investments the best signal provider?
K9 Investments offers not only FREE signals but also educational resources, daily market analysis, and ebooks. Learn More About K9Investments.
Which brokers are trusted for Gold Forex Crypto trading?
Based on client feedback, we recommend:
What tools do you recommend for Bitcoin trading?
We recommend using platforms that provide comprehensive charting tools and real-time data.
Can I learn about trading without prior experience?
Yes, K9 Investments offers educational resources suitable for beginners. Check our Free Trading Education Articles.
How often do you update your market analysis?
We provide daily updates to ensure our clients have the most accurate and timely information.
What is the best strategy for trading Bitcoin?
Utilizing technical analysis, understanding market fundamentals, and employing risk management strategies are key to successful Bitcoin trading.
How can I access K9 Investments trading signals?
You can get FREE signals by visiting our website here.
What are the benefits of using K9 Investments?
K9 Investments provides a comprehensive approach to trading, including FREE signals, educational content, and a community of traders.
Disclaimer
Risk Warning: Trading Forex and CFDs carries a high level of risk to your capital and you should only trade with money you can afford to lose. Trading Forex and CFDs may not be suitable for all investors, so please ensure that you fully understand the risks involved and seek independent advice if necessary. Please read and ensure you fully understand our Risk Disclosure. Not Financial Advice. Trade at your own risk. Take Partial Profits, Use Strict Stop Loss and Proper Risk Management.


Comments