.png)
🟡 BTCUSD Daily Market Analysis—August 12, 2025 by K9 Investments Trading
- K9 Investments

- Aug 12, 2025
- 4 min read
💬 WhatsApp K9 Investments Trading here for FREE Gold Forex Live Trade Setups & Market Analysis.
Live Market Price Overview
As of today, the live market price of Bitcoin (BTCUSD) is 119,031 USD. This analysis will explore the daily and 4-hour timeframes, utilizing various technical indicators to provide an in-depth market outlook.
Market Analysis
Support & Resistance Levels
Identifying key support and resistance levels is crucial for traders. On the daily timeframe, the support level is currently at 115,000 USD, while resistance is observed at 123,000 USD. For the 4-hour timeframe, the support level stands at 117,500 USD, and resistance is at 121,500 USD. These levels are instrumental for setting entry and exit points.
Fibonacci Retracement Levels
Using Fibonacci retracement levels helps identify potential reversal points. The daily swing high and low are critical in this analysis. The key Fibonacci levels to watch are:
23.6%: 120,000 USD
38.2%: 118,000 USD
61.8%: 115,500 USD
These levels can act as potential support or resistance points in the upcoming trading sessions.
Exponential Moving Averages (EMA)
The EMA indicators provide insights into the trend direction. The current EMA values are as follows:
Daily Timeframe:
EMA 50: 117,500 USD
EMA 100: 116,000 USD
EMA 200: 114,500 USD
EMA 400: 113,000 USD
4-Hour Timeframe:
EMA 50: 119,000 USD
EMA 100: 118,500 USD
EMA 200: 117,000 USD
EMA 400: 116,500 USD
These EMAs indicate a bullish trend in the short term, with prices trading above the key EMA levels.
RSI Divergence
The Relative Strength Index (RSI) is currently showing a divergence, indicating potential overbought conditions. The RSI value is at 72, suggesting that a correction may occur if it crosses below 70. Monitoring this indicator will be essential for anticipating market movements.
Order Blocks
Identifying order blocks can help traders understand where institutional buying and selling may occur. The recent order block is located around 119,500 USD, where significant buying interest has been noted. This area should be closely monitored for potential price action.
MACD Analysis
The Moving Average Convergence Divergence (MACD) is currently in a bullish crossover, indicating upward momentum. The MACD line is above the signal line, suggesting that buying pressure may continue in the near term.

Summary of Key Levels
💡 BTCUSD Daily Analysis Summary by K9 Investments Trading – WhatsApp
🥇 FREE Telegram Channel: @K9_Investments_GoldTrading
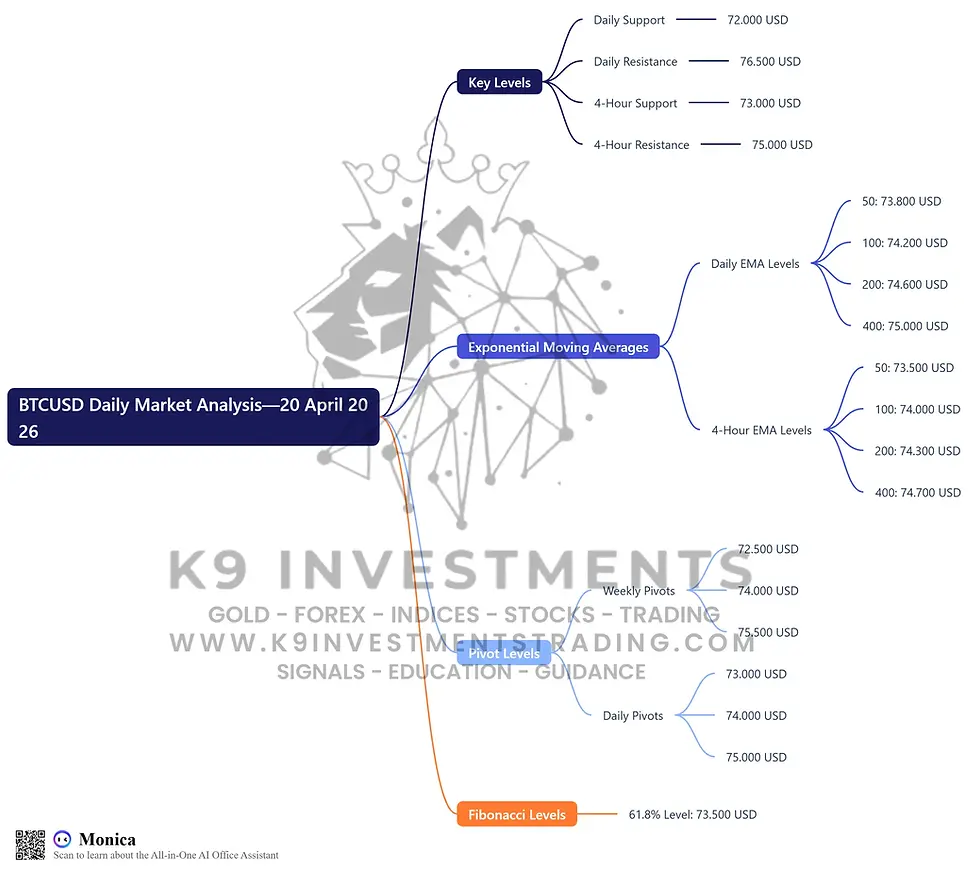
Key Levels:
Daily Support: 115,000 USD
Daily Resistance: 123,000 USD
4-Hour Support: 117,500 USD
4-Hour Resistance: 121,500 USD
EMA Levels (Daily): 50: 117,500 USD, 100: 116,000 USD, 200: 114,500 USD, 400: 113,000 USD
EMA Levels (4-Hour): 50: 119,000 USD, 100: 118,500 USD, 200: 117,000 USD, 400: 116,500 USD
Fibonacci Levels: 23.6%: 120,000 USD, 38.2%: 118,000 USD, 61.8%: 115,500 USD
Weekly and Daily Pivots
Weekly Pivot Levels:
Resistance 1: 121,000 USD
Pivot Point: 118,500 USD
Support 1: 116,000 USD
Daily Pivot Levels:
Resistance 1: 120,500 USD
Pivot Point: 118,500 USD
Support 1: 117,000 USD
Fundamental Analysis and USD News
📈 Upcoming important USD news includes the Federal Reserve's interest rate decision and employment data releases. These events could significantly impact the Bitcoin market, making it essential for traders to stay informed.
FAQs
Why is K9 Investments the best signal provider?
K9 Investments offers not only FREE signals but also educational resources, daily market analysis, and ebooks. 💎 Free Gold Forex Trading Ebooks
Which brokers are trusted for Gold Forex Crypto trading?
Based on client feedback, we recommend brokers like:
What are the benefits of using K9 Investments for trading signals?
K9 Investments provides a comprehensive suite of tools including real-time analysis, expert insights, and educational materials to enhance your trading experience.
How can I access free trading signals?
You can access free trading signals by visiting our website and signing up for updates. 💎 Get FREE Signals
What is the importance of risk management in trading?
Effective risk management is crucial to protect your capital and ensure long-term trading success. Always use stop-loss orders and take partial profits.
How often does K9 Investments update its market analysis?
K9 Investments provides daily market analysis to keep traders informed of the latest trends and opportunities.
What educational resources does K9 Investments offer?
K9 Investments offers various educational resources, including articles, videos, and ebooks to help traders improve their skills. 💡 Level 1 Forex Trading Educational Videos
Can I join the K9 Investments Telegram channel?
Yes! Join our FREE Telegram Channel Username @K9_Investments_GoldTrading here.
Conclusion
In summary, the current market analysis for Bitcoin (BTCUSD) indicates a bullish trend supported by various technical indicators. Traders should keep an eye on key support and resistance levels, as well as upcoming USD news that could influence market movements.
Disclaimer:
Risk Warning: Trading Forex and CFDs carries a high level of risk to your capital and you should only trade with money you can afford to lose. Trading Forex and CFDs may not be suitable for all investors, so please ensure that you fully understand the risks involved and seek independent advice if necessary. Please read and ensure you fully understand our Risk Disclosure. Not Financial Advice. Trade at your own risk. Take Partial Profits, Use Strict Stop Loss and Proper Risk Management.


Comments