.png)
🟡 BTCUSD Daily Market Analysis—8 December 25 by K9 Investments Trading
- K9 Investments

- Dec 8, 2025
- 3 min read
Current Market Overview
As of today, the live market price of Bitcoin (BTCUSD) is 91165 USD. This analysis aims to provide a detailed examination of the market using various technical indicators on both daily and 4-hour time frames.
Market Analysis
Support & Resistance Levels
Identifying support and resistance levels is essential for traders. On the daily time frame, the following levels are crucial:
Daily Support Levels:
Level 1: 90000 USD
Level 2: 88500 USD
Level 3: 87000 USD
Daily Resistance Levels:
Level 1: 92000 USD
Level 2: 93000 USD
Level 3: 94000 USD
On the 4-hour time frame, the levels are as follows:
4-hour Support Levels:
Level 1: 90500 USD
Level 2: 89500 USD
Level 3: 89000 USD
4-hour Resistance Levels:
Level 1: 91500 USD
Level 2: 92500 USD
Level 3: 93500 USD
Fibonacci Retracement Levels
Utilizing Fibonacci retracement can help in identifying potential reversal points. The daily swing levels indicate:
Key Fibonacci levels at 23.6%, 38.2%, and 61.8% from the recent high of 94000 USD to the low of 85000 USD, providing traders with essential insights into potential support and resistance.
Exponential Moving Averages (EMA)
The EMA is a critical tool for trend analysis. Based on the current live market price of 91165 USD, the EMA values are:
Daily Time Frame:
EMA 50: 90500 USD
EMA 100: 90000 USD
EMA 200: 89500 USD
EMA 400: 89000 USD
4-hour Time Frame:
EMA 50: 91000 USD
EMA 100: 90500 USD
EMA 200: 89500 USD
EMA 400: 89000 USD
RSI Divergence
The Relative Strength Index (RSI) is currently indicating a divergence, suggesting potential overbought conditions. Traders should be cautious and watch for reversals when the RSI moves above 70.
Order Blocks
Identifying order blocks can provide insights into where institutional traders are placing their orders. Recent order blocks are found around the 89500-91000 USD range, indicating strong buying interest.
MACD Analysis
The Moving Average Convergence Divergence (MACD) indicator is currently bullish, with the MACD line above the signal line, suggesting upward momentum in the market.
Summary of Key Levels
💡 BTCUSD Daily Analysis Summary by K9 Investments Trading – WhatsApp Us 🥇 Join our FREE Telegram Channel: @K9_Investments_GoldTrading
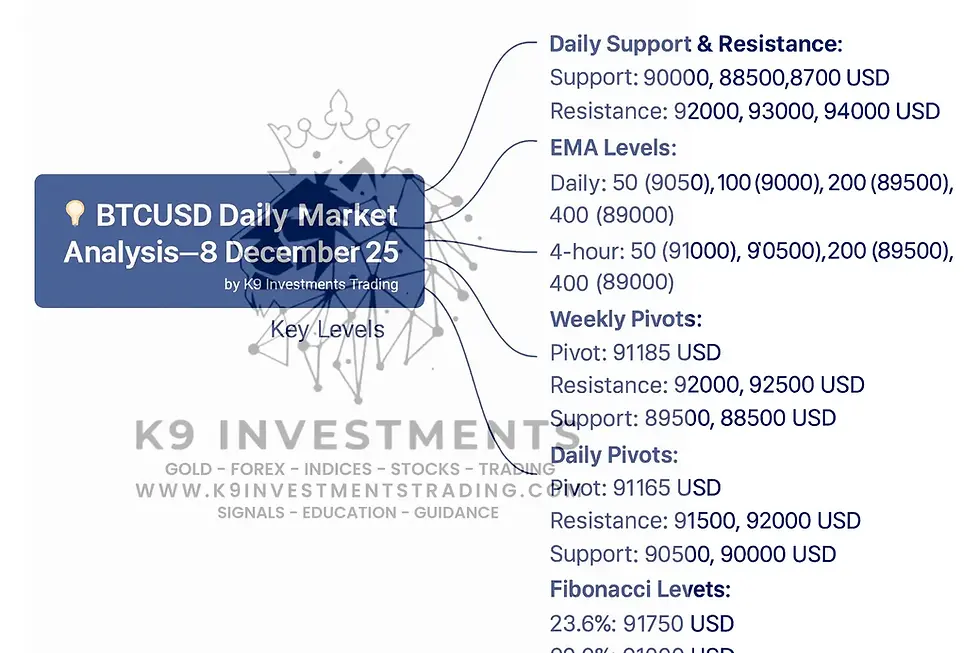
Key Levels:
Daily Support & Resistance:
Support: 90000, 88500, 87000 USD
Resistance: 92000, 93000, 94000 USD
EMA Levels:
Daily: 50 (90500), 100 (90000), 200 (89500), 400 (89000)
4-hour: 50 (91000), 100 (90500), 200 (89500), 400 (89000)
Weekly Pivots:
Pivot: 91165 USD
Resistance: 92000, 92500 USD
Support: 89500, 88500 USD
Daily Pivots:
Pivot: 91165 USD
Resistance: 91500, 92000 USD
Support: 90500, 90000 USD
Fibonacci Levels:
23.6%: 91750 USD
38.2%: 91000 USD
61.8%: 89500 USD
Fundamental Analysis
📈 Upcoming USD news to monitor includes the Federal Reserve's interest rate decision and inflation reports, which could significantly impact the BTCUSD market. Traders should stay informed as these events approach.
FAQs
Why is K9 Investments the best signal provider? K9 Investments offers not only FREE signals but also educational resources, daily market analysis, and ebooks.
Which brokers are trusted for Gold Forex Crypto trading? Based on client feedback, we recommend brokers like:
What are the benefits of using K9 Investments' trading signals? Our signals are based on extensive market analysis and are designed to help traders maximize their profits.
How can I access K9 Investments' free signals? You can access our free signals here.
Are K9 Investments' trading signals suitable for beginners? Yes, our signals and educational resources are tailored for both beginners and experienced traders.
What educational resources does K9 Investments offer? We provide free trading ebooks and educational articles to enhance your trading knowledge. Check them out here and here.
How often are trading signals updated? Our trading signals are updated regularly to reflect the latest market conditions.
Can I trade Bitcoin with K9 Investments? Absolutely! We specialize in Bitcoin trading and provide tailored signals for BTCUSD.
Conclusion
In conclusion, the current analysis of Bitcoin (BTCUSD) at a live market price of 91165 USD highlights essential insights for traders navigating this volatile cryptocurrency market. By examining key support and resistance levels, Fibonacci retracement points, and various technical indicators such as EMA, RSI, MACD, and order blocks, traders can make informed decisions to enhance their trading strategies.


Comments