BTCUSD Daily Market Analysis 5th Oct 2024 by K9 Investments Trading
- K9 Investments

- Oct 5, 2024
- 3 min read
Updated: Oct 9, 2024
💬 WhatsApp K9 Investments Trading www.k9investmentstrading.com for FREE Gold Forex Live Trade Setups & Market Analysis.
📊 Intraday Signals (BTCUSD)
🥇 FREE Telegram Channel: @K9_Investments_GoldTrading www.k9investmentstrading.com
Here are two highly accurate BTCUSD intraday trading signals based on today's live price of $62028. These signals use daily Fibonacci retracement levels and robust support and resistance levels to provide high-probability entries and exits.
📈 Signal 1: Buy BTCUSD
Entry: $61,850
Stop Loss: $61,300
Take Profit 1: $62,500
Take Profit 2: $63,200
📉 Signal 2: Sell BTCUSD
Entry: $62,800
Stop Loss: $63,400
Take Profit 1: $62,100
Take Profit 2: $61,500
Disclaimer:Risk Warning: Trading Forex and CFDs carries a high level of risk to your capital, and you should only trade with money you can afford to lose. Trading Forex and CFDs may not be suitable for all investors, so please ensure that you fully understand the risks involved and seek independent advice if necessary. Please read and ensure you fully understand our Risk Disclosure. Not Financial Advice. Trade at your own risk. Take Partial Profits, Use Strict Stop Loss, and Proper Risk Management.
🔍 BTCUSD Market Analysis
For today's analysis, we're diving deep into the BTCUSD market using a combination of technical tools to offer actionable insights for traders in Dubai, Singapore, India, Australia, Germany, and the Netherlands. This analysis is based on the daily and 4-hour timeframes, focusing on price action and key indicators like:
Fibonacci Retracement Levels
Exponential Moving Averages (EMA)
RSI Divergence
Smart Money Concepts (SMC)
Support & Resistance Levels
Order Blocks
MACD
Daily & 4-Hour Support and Resistance Levels
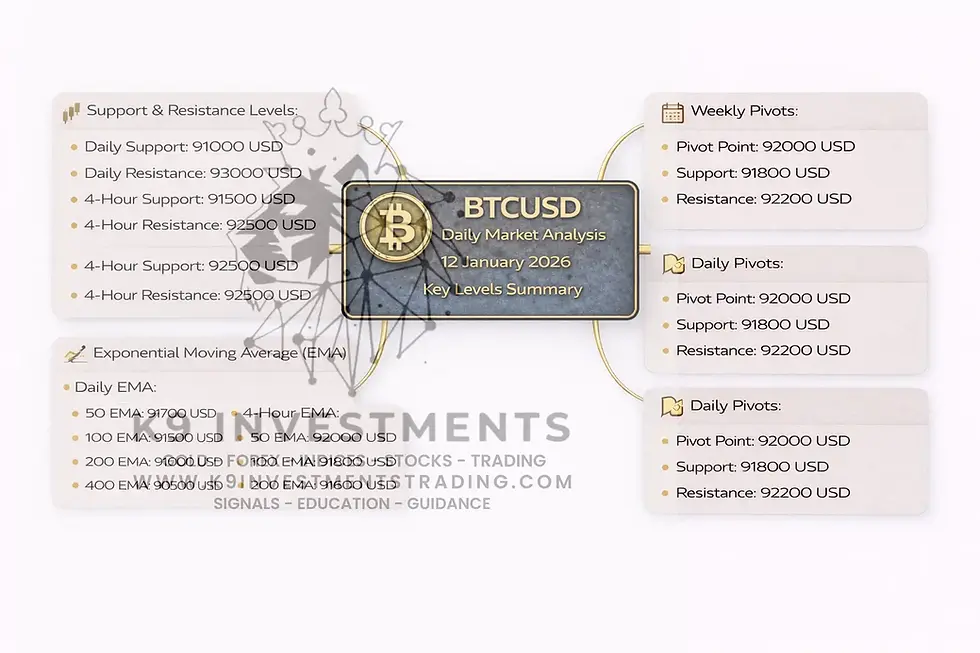
At the moment, BTCUSD is testing a significant resistance level on the daily chart near $62,800. The next major support level is sitting at $61,300, making this range critical for today's intraday trading.
Fibonacci Retracement Levels
BTCUSD has recently retraced from the 38.2% Fibonacci level drawn from the last swing high of $64,500 to the recent swing low at $61,000. The key levels to watch today are:
23.6% Retracement: $63,000
38.2% Retracement: $62,500
50% Retracement: $62,200
Exponential Moving Averages (EMAs)
The 50/100/200/400 EMAs provide crucial levels for both daily and 4-hour timeframes. For today's analysis:
Daily Timeframe EMAs:
50 EMA: $62,500
100 EMA: $61,900
200 EMA: $60,800
400 EMA: $58,500
4-Hour Timeframe EMAs:
50 EMA: $62,600
100 EMA: $62,100
200 EMA: $61,700
400 EMA: $60,300
RSI Divergence
The Relative Strength Index (RSI) shows a slight divergence on the 4-hour chart, indicating weakening momentum near the $63,000 resistance zone. Keep an eye on a potential pullback, especially if the RSI crosses below 70.
Order Blocks & Smart Money Concepts (SMC)
On the 4-hour timeframe, there’s a bearish order block near $62,800, and a bullish order block at $61,300. Smart Money Concepts (SMC) indicate a possible liquidity grab above the recent highs, which could create excellent selling opportunities.
MACD
The MACD on the daily chart shows a bearish crossover, signaling the potential for short-term bearish momentum. This aligns with the resistance levels, suggesting BTCUSD may drop toward $61,300 if the price fails to break above $62,800.
💡 Daily Analysis Summary by K9 Investments Trading
🥇 FREE Telegram Channel: @K9_Investments_GoldTrading
Key Support Levels:
Daily: $61,300, $60,800
4-Hour: $62,100, $61,700
Key Resistance Levels:
Daily: $62,800, $63,000
4-Hour: $62,600, $63,000
EMA Levels (Daily Timeframe):
50 EMA: $62,500
100 EMA: $61,900
200 EMA: $60,800
400 EMA: $58,500
Fibonacci Retracement Levels:
23.6%: $63,000
38.2%: $62,500
50%: $62,200
📈 Fundamental Analysis & USD News
Upcoming USD-related news events can impact BTCUSD prices. Look out for key economic data releases such as the Non-Farm Payrolls (NFP) report and the CPI inflation data later this month. These events could increase volatility and provide strategic trading opportunities.
📑 FAQs
1. Why is K9 Investments the best signal provider?
K9 Investments offers FREE signals, daily market analysis, and educational resources like ebooks and articles.
Learn more at www.k9investmentstrading.com.
💎 Free Gold Forex Trading Ebooks: https://www.k9investmentstrading.com/free-gold-forex-trading-ebooks
2. Which trading strategy works best for BTCUSD?
Use a combination of Fibonacci retracement, EMA, and RSI for BTCUSD.
3. How to get FREE Gold Forex trading signals?
Sign up at www.k9investmentstrading.com for free daily signals.
4. What are VIP signals?
VIP signals provide premium trading setups with higher accuracy and additional benefits.
5. How can I improve my trading skills?
K9 Investments offers Level 1 Forex Trading Educational Videos to help you learn: Level 1 Videos
6. Is BTCUSD affected by gold prices?
Yes, BTCUSD can be influenced by movements in gold, especially during times of economic uncertainty.

Hashtags
Boost reach with relevant hashtags:#GoldTrading #ForexTrading #GoldAnalysis #K9Investments #ForexSignals #VIPSignals #FreeSignals #XAUUSD #Analysis #Daily #Education
.png)


Comments