.png)


🟡 BTCUSD Daily Market Analysis—14 May 2026 by K9 Investments Trading

As of now, the live market price of BTCUSD stands at $79,433. In this analysis, we will delve into the current trends and indicators influencing the BTCUSD market, providing insights for traders across Dubai, Singapore, India, Australia, and Germany.
Market Overview
The cryptocurrency market has shown significant volatility in recent weeks, and BTCUSD is no exception. Traders are keenly observing various indicators to gauge potential price movements.
Support & Resistance Levels
Support and resistance levels are critical for understanding market dynamics. Here’s a breakdown of the daily and 4-hour timeframes:
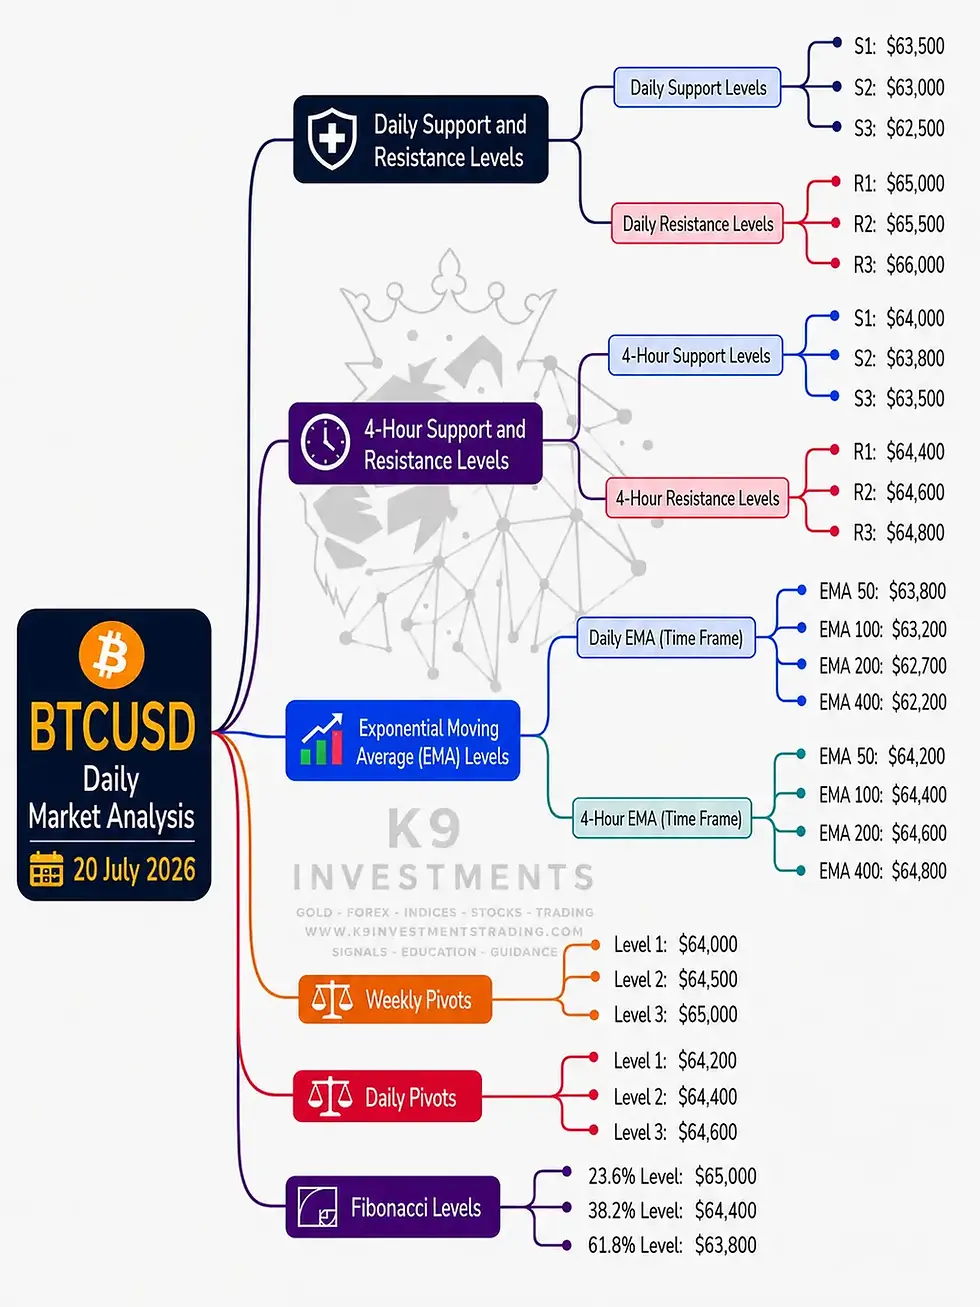
Daily Support Levels: $78,500, $77,800, $77,200
Daily Resistance Levels: $80,000, $81,200, $82,500
4-Hour Support Levels: $79,000, $78,700, $78,200
4-Hour Resistance Levels: $79,800, $80,500, $81,000
Fibonacci Retracement Levels
Utilizing Fibonacci retracement levels helps identify potential reversal points. The daily swing levels are particularly crucial:
Key Fibonacci Levels:
23.6%: $80,000
38.2%: $79,500
61.8%: $78,000
Exponential Moving Averages (EMA)
The EMAs provide insight into the trend direction:
Daily EMAs:
EMA 50: $78,900
EMA 100: $78,500
EMA 200: $78,000
EMA 400: $77,500
4-Hour EMAs:
EMA 50: $79,200
EMA 100: $79,000
EMA 200: $78,800
EMA 400: $78,600
RSI Divergence
The Relative Strength Index (RSI) is currently showing signs of divergence, indicating potential price reversals. A divergence between price action and RSI can lead to significant market movements.
Order Blocks
Identifying order blocks helps traders understand where significant buying or selling pressure may occur. Current order blocks are located around $79,000 and $78,500.
MACD Analysis
The Moving Average Convergence Divergence (MACD) is currently indicating a bullish momentum, suggesting that traders should look for buying opportunities.

Summary Heading
💡 BTCUSD Daily Analysis Summary by K9 Investments Trading – Contact Us 🥇 FREE Telegram Channel: @K9_Investments_GoldTrading
Key Levels
Daily Support and Resistance:
Support: $78,500, $77,800, $77,200
Resistance: $80,000, $81,200, $82,500
Exponential Moving Average (EMA) Levels:
Daily: 50: $78,900, 100: $78,500, 200: $78,000, 400: $77,500
4-Hour: 50: $79,200, 100: $79,000, 200: $78,800, 400: $78,600
Weekly Pivots:
Pivot 1: $79,000
Pivot 2: $79,500
Pivot 3: $80,000
Daily Pivots:
Pivot 1: $79,200
Pivot 2: $79,400
Pivot 3: $79,600
Fibonacci Retracement Levels:
23.6%: $80,000
38.2%: $79,500
61.8%: $78,000
Fundamental Analysis and Upcoming USD News
📈 Traders should be aware of upcoming USD news that could impact the BTCUSD market. Key events to watch include:
Federal Reserve Statements
Employment Reports
Inflation Data Releases
These factors can significantly influence market sentiment and price movements in the BTCUSD pair.
FAQs
Why is K9 Investments the best signal provider?
K9 Investments offers not only FREE signals but also educational resources, daily market analysis, and ebooks.
Which brokers are trusted for Gold Forex Crypto trading?
Based on client feedback, we recommend brokers like:
What are the benefits of using trading signals?
Trading signals provide insights and recommendations based on market analysis, helping traders make informed decisions.
How can I improve my trading skills?
K9 Investments offers a variety of educational resources, including articles, videos, and ebooks to enhance your trading knowledge.
What trading platforms do you recommend?
We suggest using platforms like MetaTrader 4 and 5, which are widely trusted among traders.
How often do you provide market analysis?
K9 Investments provides daily market analysis to keep traders updated on market trends.
Can I trade cryptocurrencies with K9 Investments?
Yes, K9 Investments provides insights and signals for cryptocurrency trading, including BTCUSD.
How can I join your Telegram channel?
Join our FREE Telegram Channel Username @K9_Investments_GoldTrading here.
Conclusion
In conclusion, the current analysis of BTCUSD at a live market price of $79,433 highlights the importance of utilizing various indicators such as support and resistance levels, Fibonacci retracement, EMAs, RSI divergence, and MACD to navigate the complexities of the cryptocurrency market. As we approach key economic events and USD news, traders must remain vigilant and adapt their strategies accordingly.

Comments