.png)
🟡 BTCUSD Daily Market Analysis—12 January 2026 by K9 Investments Trading
- K9 Investments

- Jan 12
- 4 min read
As of today, the live market price of Bitcoin (BTCUSD) is 92085 USD. In this analysis, we will delve into the current trends, key levels, and indicators that are shaping the Bitcoin market. This comprehensive overview will cover both daily and 4-hour timeframes, utilizing various trading indicators, including Fibonacci Retracement Levels, EMA, RSI divergence, and more.
Market Overview
Bitcoin has established itself as a leading cryptocurrency, attracting significant attention from traders and investors alike. With the current price at 92085 USD, understanding the technical landscape is crucial for making informed trading decisions.
Support & Resistance Levels
Identifying support and resistance levels is essential for any trader. On the daily timeframe, the current support level is at 91000 USD, while resistance is observed at 93000 USD. On the 4-hour timeframe, support is slightly lower at 91500 USD, with resistance at 92500 USD.
Fibonacci Retracement Levels
Fibonacci retracement levels are vital for pinpointing potential reversal points. The key retracement levels for the current price action are:
23.6%: 92300 USD
38.2%: 91800 USD
61.8%: 91200 USD
These levels indicate where traders might expect price corrections or reversals.
Exponential Moving Averages (EMA)
The Exponential Moving Averages (EMA) provide insight into the trend direction. Here are the current EMA levels based on the live market price:
Daily EMA Levels:
50 EMA: 91700 USD
100 EMA: 91500 USD
200 EMA: 91000 USD
400 EMA: 90500 USD
4-Hour EMA Levels:
50 EMA: 92000 USD
100 EMA: 91800 USD
200 EMA: 91600 USD
400 EMA: 91400 USD
RSI Divergence
The Relative Strength Index (RSI) is currently showing a divergence, indicating potential overbought conditions. The RSI level is at 70, suggesting that a correction may be imminent if the price continues to rise without a corresponding increase in momentum.
Order Blocks
Order blocks are significant areas where institutional buying or selling occurs. Currently, an order block is identified around the 92000-92100 USD range, which may act as a strong support level in the event of a pullback.
MACD Analysis
The Moving Average Convergence Divergence (MACD) is currently bullish, with the MACD line above the signal line. This indicates that the momentum is in favor of buyers, but caution is advised as the market approaches resistance levels.
Fundamental Analysis and Upcoming USD News
Understanding fundamental factors is essential for trading Bitcoin. Upcoming USD news that could impact the BTCUSD market includes:
Interest Rate Decisions: Any changes in interest rates by the Federal Reserve can significantly affect Bitcoin prices.
Inflation Reports: Higher inflation rates typically lead to increased demand for Bitcoin as a hedge against inflation.
Traders should stay updated on these reports to make informed decisions.
💡 BTCUSD Daily Analysis Summary by K9 Investments Trading
For a detailed analysis and more insights, contact us via WhatsApp or join our FREE Telegram Channel: @K9_Investments_GoldTrading.
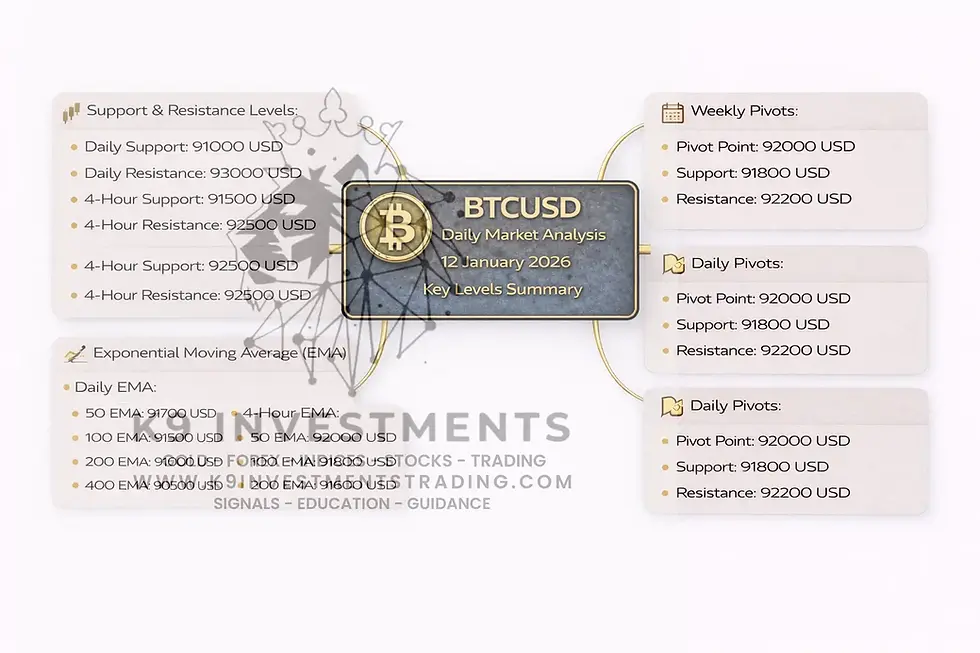
Key Levels Summary
Daily Support: 91000 USD
Daily Resistance: 93000 USD
4-Hour Support: 91500 USD
4-Hour Resistance: 92500 USD
Exponential Moving Average (EMA) Levels
Daily EMA:
50 EMA: 91700 USD
100 EMA: 91500 USD
200 EMA: 91000 USD
400 EMA: 90500 USD
4-Hour EMA:
50 EMA: 92000 USD
100 EMA: 91800 USD
200 EMA: 91600 USD
400 EMA: 91400 USD
Weekly and Daily Pivots
Weekly Pivots:
Pivot Point: 92000 USD
Support: 91800 USD
Resistance: 92200 USD
Daily Pivots:
Pivot Point: 92000 USD
Support: 91800 USD
Resistance: 92200 USD
Fibonacci Retracement Levels
Key Fibonacci levels have been outlined above, indicating potential reversal points.
FAQs
Why is K9 Investments the best signal provider?
K9 Investments offers not only FREE signals but also educational resources, daily market analysis, and ebooks. Check our resources here.
Which brokers are trusted for Gold Forex Crypto trading?
Based on client feedback, we recommend brokers like:
What are the benefits of trading Bitcoin?
Trading Bitcoin provides diversification, acts as a hedge against inflation, and offers high liquidity.
How can I manage risk while trading Bitcoin?
Implementing strict stop-loss orders, taking partial profits, and using proper risk management strategies are essential.
Where can I find educational resources for trading?
Visit our K9 Trading Education Articles & Blog for valuable insights.
What is the best time to trade Bitcoin?
The best times to trade Bitcoin are during market overlaps, particularly when both the London and New York sessions are open.
How can I receive free trading signals?
You can receive free trading signals by visiting Get FREE Signals.
What is the importance of technical analysis in Bitcoin trading?
Technical analysis helps traders identify market trends and potential entry and exit points based on historical price movements.
Conclusion
In conclusion, the current market analysis of Bitcoin (BTCUSD) at 92085 USD provides valuable insights for traders looking to capitalize on the dynamic cryptocurrency landscape. By employing various technical indicators such as Fibonacci Retracement Levels, EMA, RSI divergence, and MACD, traders can identify key support and resistance levels, facilitating informed decision-making.


Comments