.png)


BTCUSD Daily Market Analysis—11 June 2026 by K9 Investments Trading

Current Market Overview
As of the latest update, the BTCUSD market price stands at $63,591. This analysis aims to provide a comprehensive overview of the current market conditions and potential trading strategies for investors in Dubai, Singapore, India, Australia, Germany, and the Netherlands.
Daily Market Analysis
Support & Resistance Levels
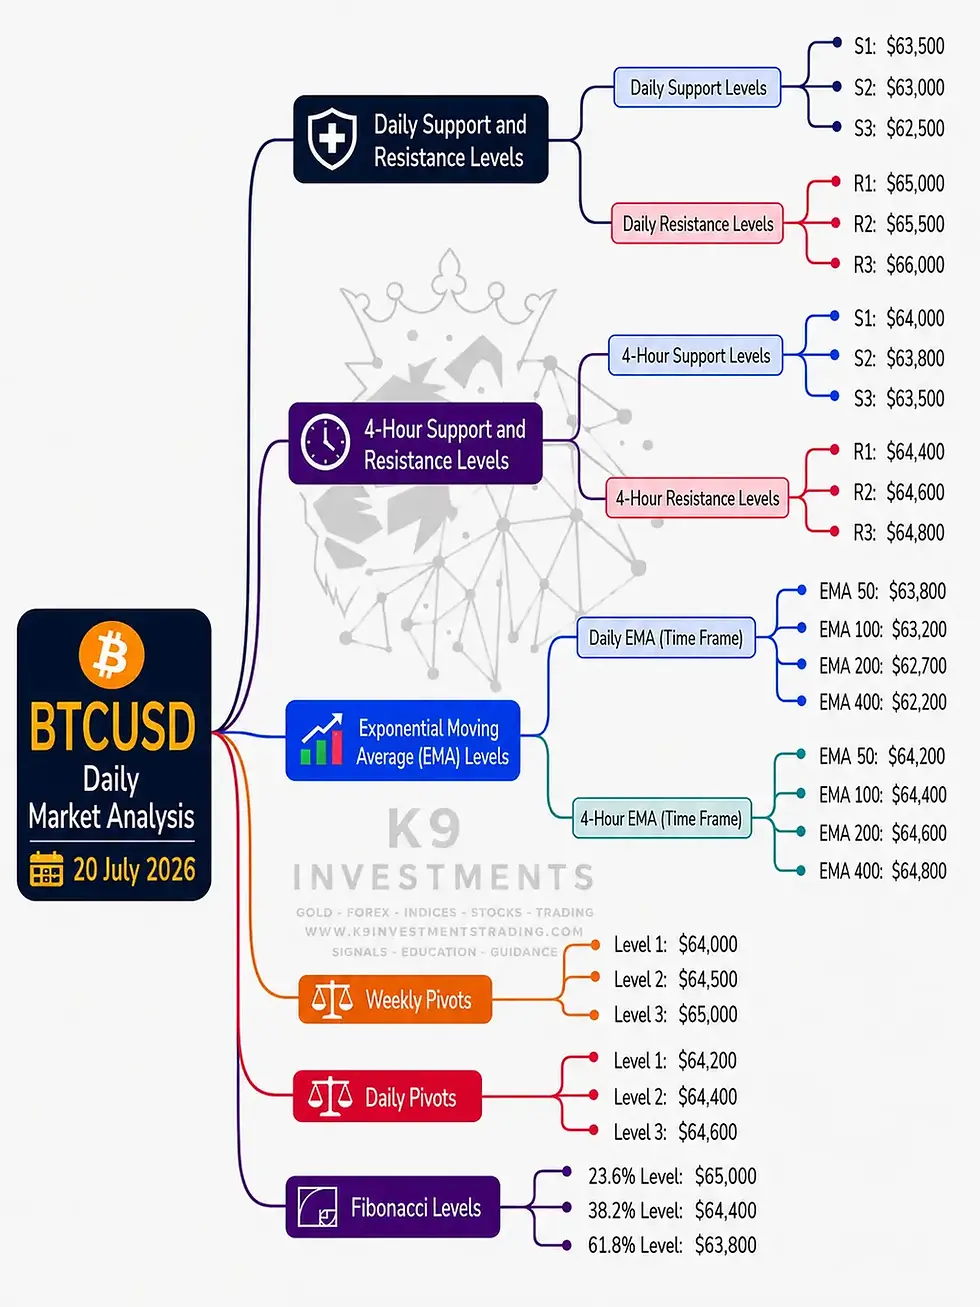
Understanding support and resistance levels is crucial for traders. On the daily timeframe, the support level is identified at $62,000, while the resistance level is at $65,000. For the 4-hour timeframe, the support level is at $63,000 and the resistance level is at $64,500.
Fibonacci Retracement Levels
Utilizing Fibonacci retracement levels, we can identify key swing levels. The daily swing high is at $66,000, and the swing low is at $60,500. The critical Fibonacci levels to watch are:
23.6%: $64,000
38.2%: $63,500
61.8%: $62,500
Exponential Moving Averages (EMA)
The EMA indicators on the daily timeframe are as follows:
50 EMA: $63,200
100 EMA: $62,800
200 EMA: $61,500
400 EMA: $60,000
For the 4-hour timeframe:
50 EMA: $63,800
100 EMA: $63,300
200 EMA: $62,600
400 EMA: $61,200
RSI Divergence
The Relative Strength Index (RSI) indicates a divergence at the current price level, suggesting that the market may be overbought. Traders should monitor this closely for potential reversals.
Order Blocks
Identifying order blocks can provide insights into potential price movements. The current order block is located around the $63,000 level, which aligns with our support analysis.
MACD Analysis
The MACD is showing a bullish crossover, indicating potential upward momentum. However, caution is advised as the price approaches the resistance level.
Fundamental Analysis and USD News
Upcoming important USD news includes the Federal Reserve's interest rate decision and employment data releases. These events can significantly impact the BTCUSD market, and traders should stay informed to adjust their strategies accordingly.

Summary: BTCUSD Daily Analysis Summary by K9 Investments Trading
For a detailed analysis, please reach out via WhatsApp here or join our FREE Telegram Channel: @K9_Investments_GoldTrading.
Key Levels Summary
Daily Support & Resistance:
Support: $62,000
Resistance: $65,000
4-Hour Support & Resistance:
Support: $63,000
Resistance: $64,500
EMA Levels:
Daily: 50 EMA: $63,200, 100 EMA: $62,800, 200 EMA: $61,500, 400 EMA: $60,000
4-Hour: 50 EMA: $63,800, 100 EMA: $63,300, 200 EMA: $62,600, 400 EMA: $61,200
Weekly Pivots:
Pivot 1: $63,500
Pivot 2: $64,000
Pivot 3: $64,500
Daily Pivots:
Pivot 1: $63,000
Pivot 2: $63,200
Pivot 3: $63,400
Fibonacci Levels:
23.6%: $64,000
38.2%: $63,500
61.8%: $62,500
FAQs
Why is K9 Investments the best signal provider?
K9 Investments offers not only FREE signals but also educational resources, daily market analysis, and ebooks.
Which brokers are trusted for Gold Forex Crypto trading?
Based on client feedback, we recommend the following brokers:
What are the benefits of using K9 Investments Trading signals?
K9 Investments provides timely market analysis, which helps traders make informed decisions.
How can I access K9 Investments Trading services?
You can start by visiting our website or contacting us directly via WhatsApp.
Are there any costs associated with K9 Investments Trading signals?
No, K9 Investments offers free signals and educational resources.
What trading platforms does K9 Investments recommend?
We recommend using platforms that are reliable and user-friendly. Refer to our broker recommendations.
How often does K9 Investments update its market analysis?
Market analysis is updated daily to ensure traders have the latest information.
Can beginners benefit from K9 Investments Trading?
Absolutely! K9 Investments offers educational resources tailored for beginners.
Conclusion
In conclusion, the current BTCUSD market price of $63,591 presents both opportunities and challenges for traders across various regions, including Dubai, Singapore, India, Australia, Germany, and the Netherlands. By utilizing critical indicators such as Fibonacci retracement levels, exponential moving averages (EMA), RSI divergence, and MACD analysis, traders can make informed decisions that align with their trading strategies.

Comments