Bitcoin BTCUSD Daily Market Analysis - Sep 24, 2024 by K9 Investments Trading
- K9 Investments

- Sep 24, 2024
- 3 min read
Updated: Oct 9, 2024
WhatsApp K9 Investments Trading Market Analysts and get Free Gold Forex live trade setups and analysis.
BTCUSD
Bitcoin's current live market price is $63,153. BTC has shown bullish momentum in recent weeks but remains within a broad range of key technical levels. The analysis focuses on short-term and intraday signals, leveraging a variety of technical indicators to guide potential trade setups.
2. Intraday Signals and Technical Analysis
Using a combination of Fibonacci retracement, EMA crossovers, RSI divergence, and weekly pivots, here are two intraday trading signals based on the live price:
Signal 1 - Bullish Setup:
Buy above: $63,300
Target levels: $63,800, $64,200
Stop loss: $63,000
This signal is based on the price bouncing off the 50% Fibonacci retracement level and support at the 100 EMA. Momentum from RSI divergence and an uptrend on the hourly charts supports the possibility of a continued upward move.
Signal 2 - Bearish Setup:
Sell below: $62,950
Target levels: $62,400, $61,900
Stop loss: $63,200
This sell signal stems from the price approaching the 200 EMA and a strong resistance zone. RSI shows overbought conditions on the 4-hour chart, indicating potential exhaustion of the bullish move.
3. Detailed Market Analysis Using Indicators
Bitcoin's market price around $63,153 has entered a consolidation phase, oscillating between critical support and resistance levels. For new traders, understanding key indicators like Fibonacci retracements, Exponential Moving Averages (EMAs), and the RSI can be crucial for identifying profitable entry and exit points.
Fibonacci Levels: Currently, the 50% retracement from the last major swing low aligns around $63,000, acting as a support level. Meanwhile, the 61.8% Fibonacci level sits near $63,700, which is the key resistance BTCUSD needs to break for further upside momentum.
EMA Crossovers: The 100, 200, and 400 EMAs are providing significant insight into trend direction. As of now, Bitcoin is trading just above the 100 EMA on the daily chart, indicating a potential continuation of the bullish trend. However, should price action fall below the 200 EMA at $62,900, it may signal a bearish reversal.
RSI Divergence: On the 4-hour chart, we see a potential bearish divergence with the RSI approaching overbought levels above 70. If this divergence plays out, traders should look for a bearish signal below $62,950.
Weekly Pivots & Support/Resistance: The weekly pivot point is seen at $63,050, which is crucial for short-term direction. Support levels lie at $62,400 and $61,900, while resistance can be found at $63,800 and $64,300. Traders should watch price action at these levels for potential breakouts or reversals.
Smart Money Concepts (SMC): Smart money flows indicate a range-bound market, with institutions potentially looking to accumulate below $63,000. This zone becomes vital for buy opportunities if price revisits these levels. In contrast, liquidity could be hunted near $64,200, triggering a short-term sell-off.
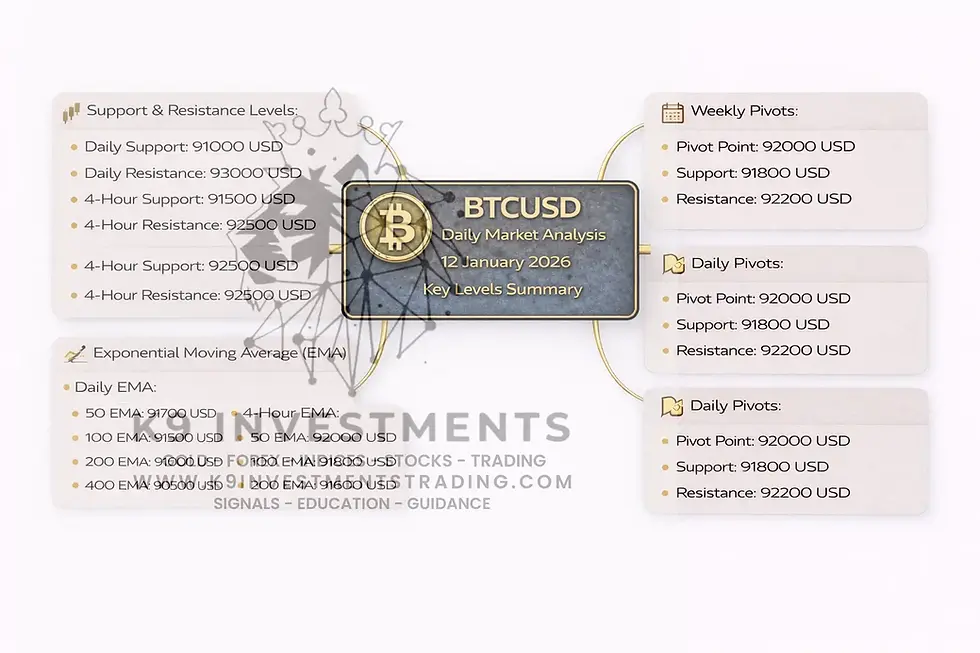
4. Key Technical Levels Summary (Daily and 4H Time Frame)
Support Levels:
1st Support: $62,400
2nd Support: $61,900
Resistance Levels:
1st Resistance: $63,800
2nd Resistance: $64,300
Fibonacci Levels:
50% Retracement: $63,000
61.8% Retracement: $63,700
EMA Levels:
100 EMA: $63,000
200 EMA: $62,900
400 EMA: $62,400
Daily Pivot: $63,050
Weekly Pivot: $63,000
Frequently Asked Questions (FAQs)
1. What are trading signals, and how do they help in Forex trading?
Trading signals are alerts for buying or selling opportunities based on technical analysis. They help traders make informed decisions by providing actionable insights, especially in fast-moving markets like Forex.
2. How can I start receiving live Forex trading signals in Singapore?
You can subscribe to signal providers like K9 Investments Trading or join platforms that offer real-time alerts via WhatsApp, Telegram, or email.
3. What are the best platforms for Forex trading in India?
Some of the best platforms for Forex trading in India are MetaTrader 4 (MT4), MetaTrader 5 (MT5), Zerodha, and K9 Investments Trading.
4. How reliable are trading signals for Bitcoin in Dubai and Singapore?
Reliable signals come from trusted providers like K9 Investments Trading, but due to Bitcoin's volatility, no signal is 100% accurate. Proper risk management is crucial.
5. Can beginners in India use trading signals effectively?
Yes, beginners can use trading signals to simplify trading decisions, but learning the basics of Forex trading is recommended for long-term success.

For more information on brokers, visit:https://www.k9investmentstrading.com/all-k9-brokers-info-summaryLearn more about us:https://www.k9investmentstrading.com/about-us
Hashtags:
#BitcoinAnalysis #BTCSignals #K9InvestmentsTrading #ForexLiveSetups #BitcoinTrading #CryptoTrading #ForexInDubai #ForexInSingapore #ForexInIndia
.png)


Comments